




- Published on: 2026-10-19 10:17:13
Wyckoff Method Explained Simply: Read Market Structure, Not Just Patterns

A textbook Wyckoff pattern can look obvious only after the move is over. That’s why Wyckoff method explained simply starts with a different premise: read the relationship between price, volume, and market context instead of treating a schematic as a guaranteed signal. Accumulation, distribution, and the Composite Man can sound abstract, especially when a live chart doesn’t follow the textbook script.
If you’ve struggled to tell a useful clue from a pattern that only makes sense in hindsight, you’re not alone. Wyckoff is a framework for interpreting how supply and demand may be shaping a market, not a shortcut to certain outcomes. The practical challenge is to assess evidence in context rather than force every chart into a familiar pattern.
This guide explains Wyckoff’s core ideas in plain language and gives you a repeatable process: establish the market context, assess price and volume together, and look for confirmation or signs that your interpretation may be wrong. You’ll also see where the method’s limits matter, so you can practise with clear expectations and treat each setup as a possibility, not a promise.
Key Takeaways
- Use the three Wyckoff laws as connected lenses for interpreting market behaviour, not as standalone entry signals.
- Compare accumulation and distribution by studying trading-range behaviour, while treating each as an interpretation rather than proof of market intent.
- Apply the Wyckoff method explained simply with a repeatable sequence: start with the broader trend, then examine the range and price-volume action.
- Use chart replay and scenario notes to practise forming and testing market interpretations before making live decisions.
- Review where your analysis was supported or contradicted by the chart, and remember that no pattern guarantees an outcome.
Wyckoff Method Explained Simply: What It Is and What It Tries to Read
The Wyckoff method is a chart-analysis framework that uses price and trading volume to assess supply, demand, and the wider market context. It helps traders consider whether buying or selling pressure may be strengthening, weakening, or shifting, then build possible scenarios from that evidence. It doesn’t predict every move or guarantee a result.
Richard Wyckoff developed these ideas by studying how markets moved and how large operators could influence activity. The useful starting point isn’t to memorise a chart schematic. Instead, observe what the market is doing: where price is moving, how much trading activity accompanies that move, and whether the response supports or contradicts your initial reading.
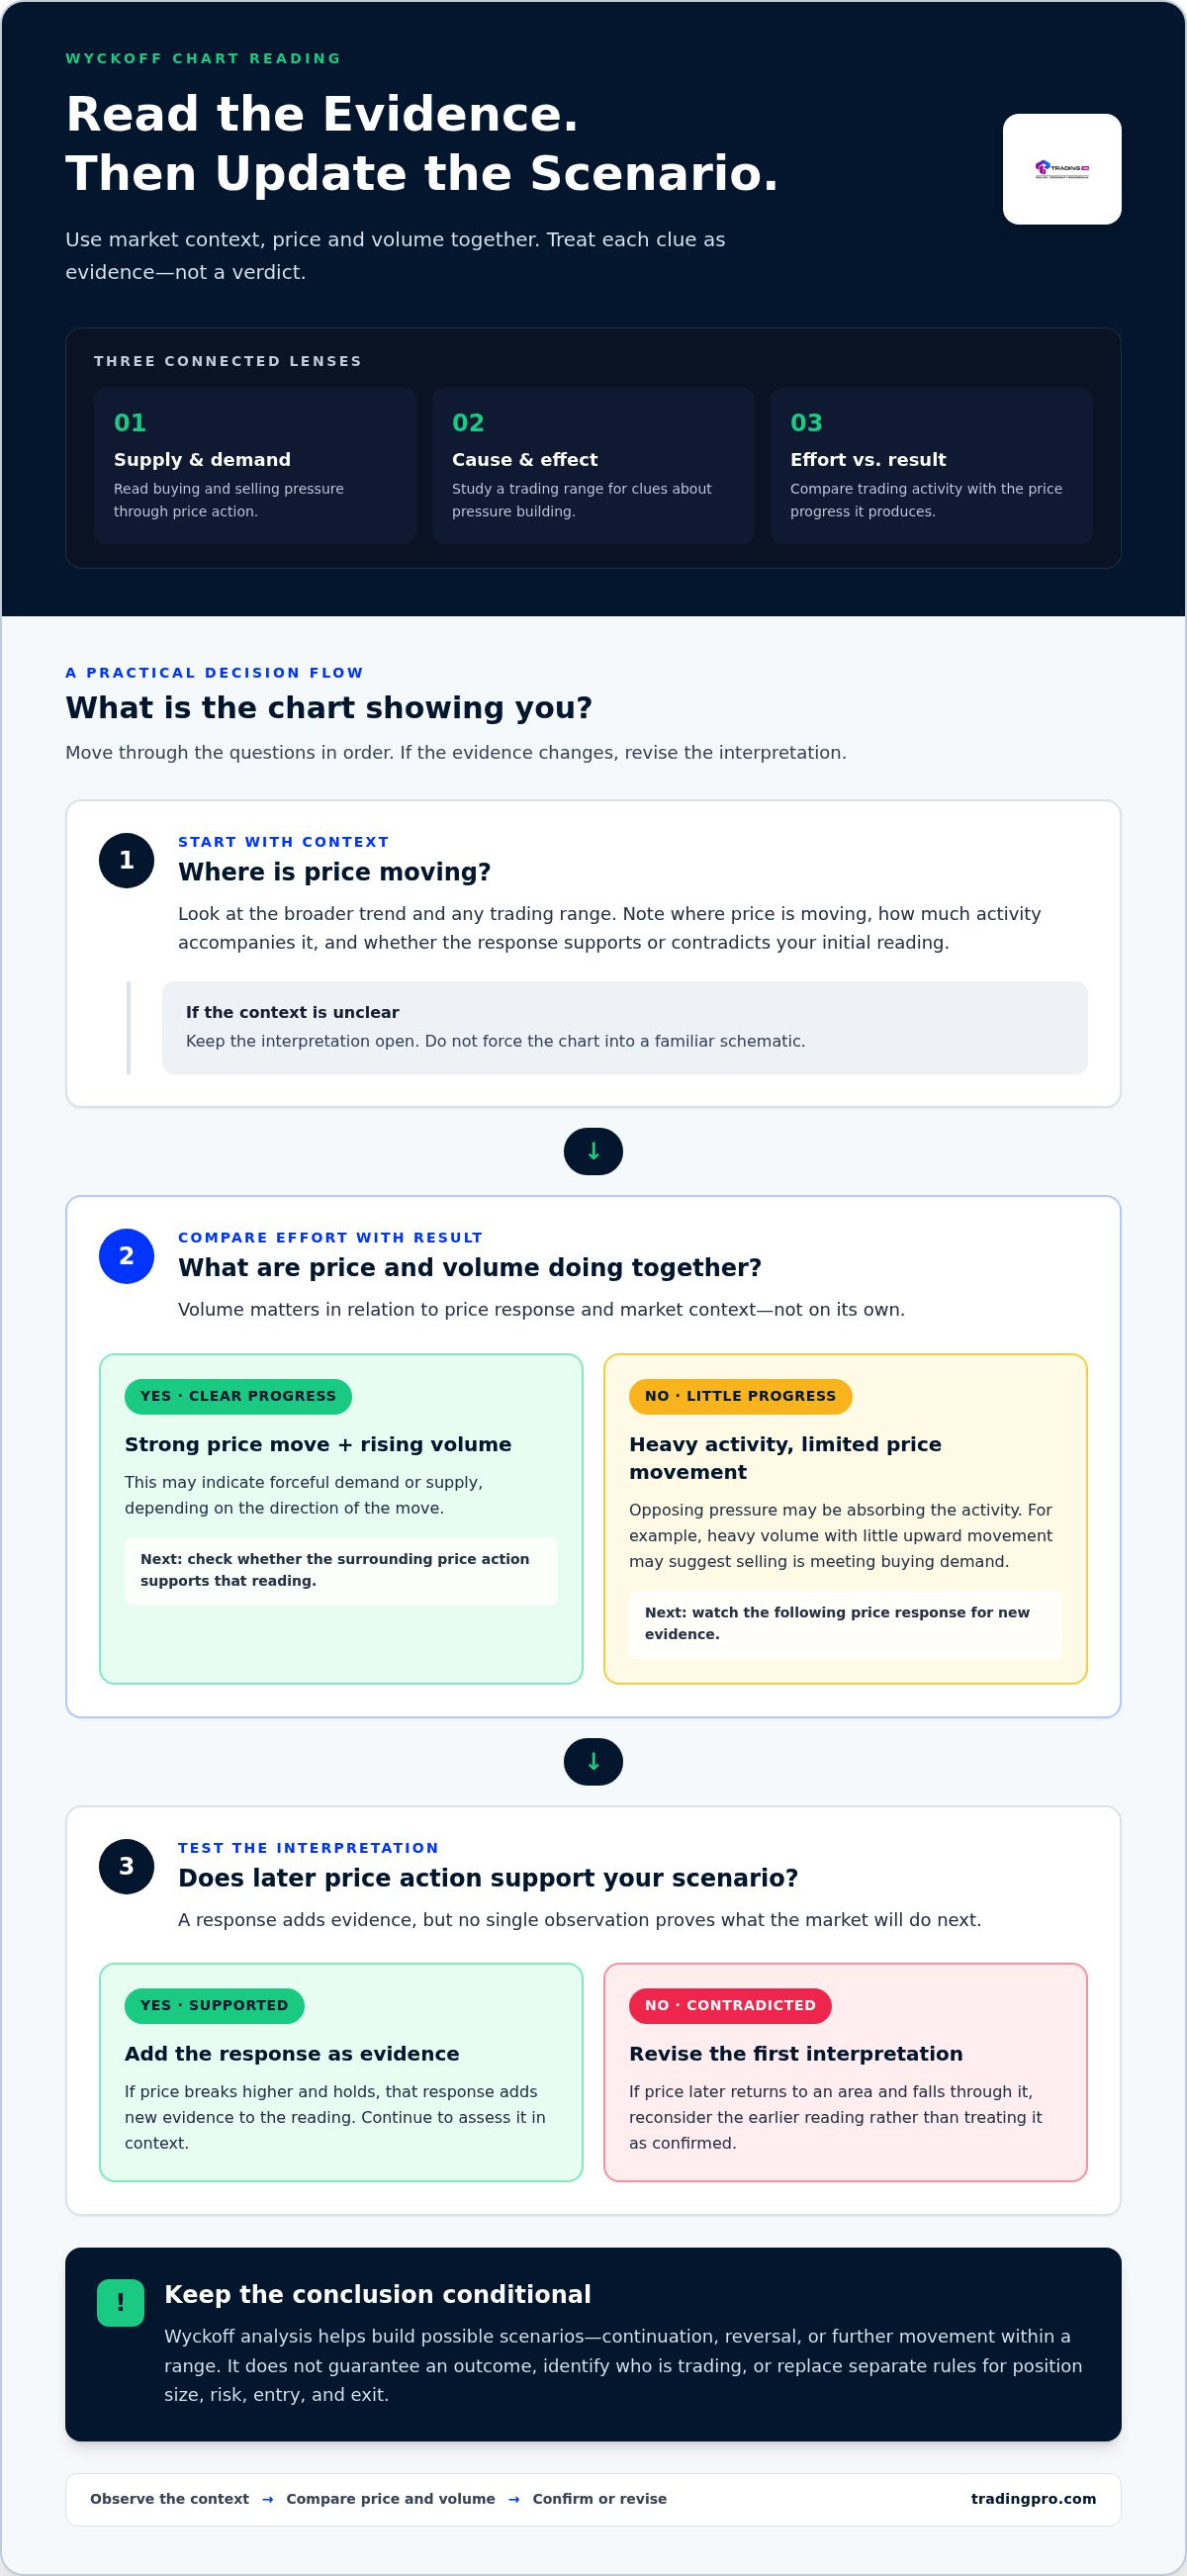
For example, imagine price falls toward a prior low, then quickly rebounds as trading activity increases. That response may suggest buyers are meeting the selling pressure, but it doesn’t prove that a lasting reversal has begun. If price later returns to the area and falls through it, revise the first interpretation. Treat each clue as evidence to assess, not a verdict.
What does the Wyckoff method help a trader analyse?
The framework helps organise observations about price movement and trading activity. A strong price move with rising volume may indicate forceful demand or supply. A large amount of activity with little price progress may suggest that opposing pressure is absorbing it. These are questions to investigate, not fixed rules that produce a signal on their own.
Use the evidence to form possible scenarios: continuation, reversal, or further movement within a range. Chart interpretation is only one part of trading. It doesn’t set your position size, define acceptable risk, or provide a complete plan for entering and exiting a trade. Those decisions require separate rules suited to your circumstances.
Who is the Composite Man in Wyckoff analysis?
The Composite Man is a conceptual model for thinking about the combined actions of large, coordinated market interests. It isn’t one identifiable person or group whose intentions can be confirmed from a chart. The idea encourages you to consider how substantial buying or selling could affect price, without assuming you know exactly who is acting or why.
Keep your analysis anchored to observable evidence. Instead of deciding that a large operator is secretly accumulating, note what the chart shows: price has held within a range, downward pushes have made less progress, or activity increased during a rebound. Then consider more than one explanation and watch what happens next. That discipline is the practical heart of Wyckoff method explained simply: read market behaviour, test your interpretation, and stay ready to change it.
The Three Wyckoff Laws: How Price, Volume, and Market Structure Connect
Wyckoff’s three laws offer a practical way to organise chart evidence: supply and demand, cause and effect, and effort versus result. Treat them as complementary lenses, not independent signals. A rise in price, a busy trading range, or a volume spike means little in isolation. Wyckoff method explained simply means checking how these clues fit together before forming a market scenario.
Supply and demand: reading pressure through price action
Supply is the willingness or pressure to sell; demand is the willingness or pressure to buy. Price changes as these forces interact. If buying interest outweighs selling pressure, price may rise. If selling pressure dominates, it may fall. The movement suggests an imbalance, but it doesn’t tell you exactly who is trading or why.
Imagine an asset rising through a trading range while volume expands. Buyers may be gaining control, especially if pullbacks are brief and price continues to advance. Compare that with repeated rallies that stall and turn lower: selling pressure may be absorbing demand. Context matters. A rise after a prolonged decline may mean something different from the same rise during an established uptrend, so check the surrounding price action before drawing a conclusion.
Cause and effect, effort and result: what the other laws mean
Cause and effect connects a period of consolidation, the “cause,” with a potential later move, the “effect.” In Wyckoff analysis, a trading range is studied for clues about whether pressure may be building. The range doesn’t guarantee a breakout or determine its size. Treat it as a structure to assess, then look for price behaviour that supports or weakens your scenario.
Effort versus result compares trading activity with the amount of price progress. For example, heavy volume with little upward movement may suggest that selling is meeting buying demand. If price then breaks higher and holds, that response adds new evidence. Neither observation works as a fixed rule. Volume data can vary by market and trading venue, and a chart may show activity from a particular source rather than a complete market picture. Binance’s Wyckoff Method Explained: Understanding Market Cycles also discusses these laws alongside the method’s broader concepts.
Volume only becomes meaningful when you compare it with price response and market context. An active session can still show limited progress, while a quieter move may carry price farther. Ask what changed, how price responded, and whether the next move confirms your reading. Together, the three laws help you build and update a scenario, not declare a certain outcome.
Practise noting each law separately on historical charts, then compare your observations. When you’re ready to explore a trading environment, a TradingPRO Rookie Account is one of the account options available. Wyckoff analysis remains a skill to develop, not a promise of trading results.
Wyckoff Accumulation and Distribution: Read the Market Cycle Without Forcing a Pattern
Wyckoff analysis groups market behaviour into phases, but real charts rarely match a schematic perfectly. Accumulation and distribution are interpretations of what may be happening within a trading range, not visible proof of traders’ intentions. Weigh the context, price behaviour, and volume, and keep your reading open to revision.
Accumulation and distribution: the beginner’s comparison
Both interpretations begin with a market moving sideways after a prior directional move. The distinction is the pressure the evidence may suggest and what could follow. A range alone confirms neither one. Price can pause for many reasons, so look at behaviour within and around the range before assigning a label.
| Clue | Possible accumulation | Possible distribution |
|---|---|---|
| Possible context | A range after a decline | A range after an advance |
| Pressure to assess | Selling may be easing as buying absorbs supply | Buying may be weakening as selling absorbs demand |
| Potential follow-through | Price may move into markup | Price may move into markdown |
These are illustrative possibilities, not forecasts. A range after a decline might eventually break lower, while a range after a rally could continue upward. Give more weight to what price does at the range boundaries and whether later movement supports your interpretation. If the evidence conflicts, leave the phase unclassified rather than forcing a neat answer.
How phases and events fit into a Wyckoff schematic
The broad cycle has four phases: accumulation, markup, distribution, and markdown. Markup describes a sustained upward phase that may follow accumulation; markdown describes a sustained downward phase that may follow distribution. Neither transition is automatic. Markets can remain range-bound, reverse, or develop structures that don’t fit a textbook sequence.
Wyckoff schematics also use named events to describe price behaviour inside and around ranges. Those labels can help organise observations, but they aren’t instructions to buy or sell. Read an event in relation to the surrounding structure, its volume, and the market’s response afterward. Beginners don’t need to memorise every label before interpreting a chart.
Wyckoff schematics are flexible models for reading market behaviour, not fixed chart templates to match at any cost. Start with a broad possibility, mark the evidence that supports it, and note what would challenge it. That’s Wyckoff method explained simply: use phases to frame a reading, not to turn an ambiguous chart into certainty.
How to Apply the Wyckoff Method: A Practical Chart-Reading Sequence
Use the Wyckoff method explained simply as a disciplined chart-reading routine, not a hunt for a perfect schematic. Move from broad context to specific evidence, and write down what would change your mind. This process helps keep an interpretation separate from a trade decision.
A five-step process for analysing a Wyckoff chart
Work through these steps in order. Keep the chart timeframe consistent as you assess the structure, and note when a clue is uncertain rather than filling gaps with assumptions.
- Set the context. Identify the broader trend and the timeframe you’re analysing. A sideways pause within an established uptrend may mean something different from a range following a prolonged decline.
- Mark the range. If price is moving sideways, identify its approximate upper and lower boundaries. Note whether the boundaries are clear or messy, and avoid labelling the structure before examining its behaviour.
- Compare price and volume. Review how price responds near the range edges and during advances or declines. Ask whether activity accompanies meaningful progress, or whether effort seems to produce little movement. Interpret volume with the limits of your market data in mind.
- Write competing scenarios. For example, price could break above the range and continue higher, or fail near resistance and return inside it. State the evidence that would support each possibility, rather than committing to one story prematurely.
- Wait, then review. Let new price action test your scenarios. Record what would invalidate each one, such as a break that fails to hold or a move through a level that changes the structure. Update your notes when evidence changes.
Common beginner mistakes and the method’s limits
Don’t call every range accumulation or distribution. Similar-looking structures can develop in different contexts, and ambiguous charts may not offer enough evidence for a confident interpretation. Hindsight bias is another trap: once a move is complete, earlier clues can seem more decisive than they were in real time.
Volume data can vary by market and trading venue, so the chart may not show a complete picture of activity. Practise on historical charts and keep a journal: record your initial read, the evidence you used, what would disprove it, and what happened next. This makes it easier to spot when your rules are vague or your interpretation shifts after the outcome is known.
Analysis still isn’t a risk plan. Define trade risk and position sizing separately, based on your own approach and circumstances. No Wyckoff event removes uncertainty or guarantees a result. When you’re ready to explore a trading environment while continuing to practise your chart-reading process, TradingPRO’s account registration page is available.
Practise Wyckoff Analysis with a Clear Plan Before You Trade
Understanding the ideas is only the start. Build skill by practising how you read a chart before making live decisions. The aim isn’t to prove that every interpretation is right. It’s to create a consistent process, notice where your reasoning holds up, and learn how to adjust when the evidence changes.
Build skill through structured chart practice
Use chart replay or historical charts to review price action one section at a time. Pause before revealing what happened next. Write down your initial view, the clues behind it, and what would make you reconsider. Then reveal the next portion of the chart and compare the outcome with your notes. This helps reduce hindsight bias, where a completed move makes an uncertain setup seem obvious.
Keep a journal with a simple structure:
- Context: Note the market, timeframe, and broader direction you see.
- Scenario: Record the possible interpretation, such as continued range movement or a potential breakout.
- Evidence: List the price and volume clues that support your view, along with evidence that challenges it.
- Review: Record what happened next and whether your original reasoning was clear, incomplete, or contradicted.
Review a range of charts, including examples that don’t develop into a clean schematic. Practice is especially useful when a chart stays ambiguous: you learn to leave it undecided rather than force it into a pattern. Revisit your notes regularly and look for repeated habits, such as overlooking opposing evidence or changing your interpretation after seeing the outcome. For broader foundational concepts, a forex trading for beginners guide can complement this chart-reading practice.
Choose a next step that matches your experience
Keep analysis, strategy, and account choice separate. A trading account doesn’t confirm that a Wyckoff interpretation is correct, and the method doesn’t determine how much risk is appropriate for you. Before moving from replay to live decisions, make sure you have a separate plan for position sizing, entries, exits, and acceptable risk. Continue practising if those rules aren’t clear yet.
TradingPRO offers a Rookie Account as one of its account tiers. The Rookie Account gives you an option to explore as you develop your chart-reading routine. Keep the goal measured: applying Wyckoff consistently is a skill to practise, not a promise of trading results. Chart replay, honest scenario notes, and careful review remain useful whether you’re preparing to trade or still building your foundations.
Make Your Next Chart a Practice Session
Turn the ideas into a repeatable habit. Before each chart review, write down what you’re testing and what evidence could change your view. Afterward, assess the quality of your reasoning, not just whether price moved in the direction you expected. That’s how “Wyckoff method explained simply” becomes a practical skill: not a formula for certainty, but a framework you can keep refining.
When you’re ready to explore a trading environment, TradingPRO offers Rookie, Micro, Pro, and Scalp account tiers, as well as a Social Trading and Copy Trading ecosystem. Keep practising independently of any account or strategy. Explore TradingPRO account options.
Build the habit first. Each thoughtful review is another chance to sharpen your chart-reading process.
Frequently Asked Questions
Is the Wyckoff method suitable for beginners?
Yes, beginners can learn Wyckoff, especially by starting with one market and one chart timeframe. Focus first on describing what you can see, such as swing highs, lows, and changes in activity, before applying labels. The Wyckoff method explained simply can help structure those observations, but it takes practice to interpret them consistently. Use replay or historical charts first, and keep a separate risk plan before considering live trades.
Can the Wyckoff method be used in forex markets?
Yes, traders can apply Wyckoff concepts to forex charts by studying price behaviour and available activity data. A key practical consideration is that spot forex trading is decentralised, so a chart’s volume measure may reflect activity from a particular data source rather than the entire market. Treat it as context, not a complete market total. Compare readings consistently on the same platform and timeframe instead of assuming all feeds show identical activity.
How does the Composite Man concept work in Wyckoff analysis?
The Composite Man is a mental model for considering how large market interests might collectively influence price, not a real person you can identify on a chart. Use the idea to test observable evidence: for instance, does price repeatedly recover after downward moves, or do rallies lose momentum near a resistance area? Avoid turning those observations into claims about a hidden actor’s identity or exact plan. The model supports disciplined questions, not certainty about motives.
How long does accumulation or distribution usually last?
There’s no fixed duration. A range interpreted as possible accumulation or distribution can persist for different lengths of time depending on the market, timeframe, and conditions. A structure that looks brief on a daily chart may contain more detail on an hourly chart. Rather than setting a deadline, track the boundaries and observe whether price continues to respect them or begins to move beyond them. Don’t assume a long range must break soon.
Can Wyckoff analysis work without volume data?
You can still study price structure without volume, but you lose an important source of context for assessing trading activity. If volume isn’t available or reliable for your market, state that limitation in your notes and avoid making conclusions that depend on volume confirmation. For example, you might describe a breakout’s price behaviour while leaving its participation uncertain. Don’t substitute an imagined volume story for missing data.
Does the Wyckoff method guarantee profitable trades?
No. Wyckoff is an interpretive framework, not a guarantee of profit or a complete trading system. A reading can be wrong, and even a well-reasoned scenario can fail as market conditions change. Before acting, define your risk limits, position size, and conditions for exiting independently of the chart interpretation. Review decisions across a series of examples, including unsuccessful ones, rather than judging the method by a single outcome.
What is the difference between Wyckoff accumulation and a regular trading range?
A regular trading range is simply an area where price moves between boundaries for a period. Calling it possible accumulation adds an interpretation that buying may be absorbing available selling pressure, often in the context of an earlier decline. The range itself doesn’t establish that reading. Consider the preceding trend and behaviour around the boundaries, and leave the structure unlabelled if the evidence doesn’t distinguish it from an ordinary pause.


