




- Published on: 2026-10-28 10:18:34
Using Daily Charts for Swing Trading to Read Trends and Key Levels
A faster chart doesn’t necessarily give a better swing-trading view. The daily chart is the preferred time frame for swing trading, although a 4-hour chart can also work. Using daily charts for swing trading helps you read the broader trend and key price levels without letting shorter-term moves take over the picture.
It’s natural to focus on finding a precise entry, but first get a clear view of the larger trend. Start with the weekly chart, then use the daily chart to assess direction, support and resistance, and whether a setup fits your plan.
This guide shows you how to identify trends across stocks and sectors, compare weekly, daily, 4-hour, and hourly charts, and interpret support and resistance when planning a swing trade. You’ll also see how timeframe choice affects the detail you get and the kind of holding period a chart setup may suit. Build your analysis from the broad view down, then use key levels to make a more structured decision.
Key Takeaways
- Start with the weekly chart to assess the broader direction, then use the daily chart to examine trend structure and potential setups.
- Choose a chart timeframe that suits your intended holding period, and size positions around the stop distance.
- Mark clear support and resistance zones, then look for trend alignment before planning an entry.
- Compare weekly, daily, and shorter timeframes to separate the larger market picture from entry-level detail.
- Use a consistent chart routine to make swing-trading decisions more structured and repeatable.
1. Identifying trending stocks and sectors
To identify trends and support or resistance on a daily chart, mark swing highs and lows, then check whether price is making higher highs and higher lows or lower highs and lower lows. Draw support and resistance zones around areas where price has repeatedly reversed or paused, rather than treating every level as an exact line.
Start with the weekly chart to establish direction before reviewing daily setups. In the Apple example, the weekly chart identifies support above the previous peak near $175 per share. That level gives context: the daily chart can show whether price is holding above the former resistance area or breaking back below it.
Next, compare stocks within their sectors. Look for sector charts with a clear sequence of rising swing lows, then check whether individual stocks show similar strength. If a sector is trending upward but a stock repeatedly makes lower lows, that mismatch can signal weaker price action. A trend line connecting rising daily swing lows makes the comparison easier to see. Redraw it when a meaningful new low forms.
A trend-pullback setup looks for a pause against the larger direction, not a sudden reversal. In an uptrend, price may retreat toward prior support or a rising trend line, then stabilize. Watch how the daily candles respond in that area. A decisive move back upward offers a clearer trend-following entry than buying simply because price has fallen.
A bull flag is one useful continuation pattern. It begins with a sharp upward impulse on high volume, followed by a less aggressive pullback. The break above the flag can serve as an entry signal for a long position. On most trading days, there are hundreds of bull flag patterns to choose from, so filter for alignment with the weekly direction and a clear level to define the setup.
Common entry and exit rules start with a defined trigger and invalidation point. For a bull flag, consider entry when price breaks the flag; place a protective stop where the pullback structure no longer holds, and plan an exit near the next resistance area or according to a predetermined target. For forex, one suggested starting point is a stop 10 to 20 pips above or below the candlestick being traded.
- Scan weekly charts for clear direction and sector strength.
- Mark daily swing highs, swing lows, support, resistance, and trend lines.
- Prioritize pullbacks and bull flags that align with the broader trend.
The most useful daily chart patterns for swing trading stocks fit a visible trend and offer a clear trigger. Bull flags are one example. Before acting, assess the pullback, breakout level, and nearby resistance. A pattern label alone doesn’t establish a trade; the surrounding price structure provides the decision points.
2. What is the Best Time Frame for Swing Trading?
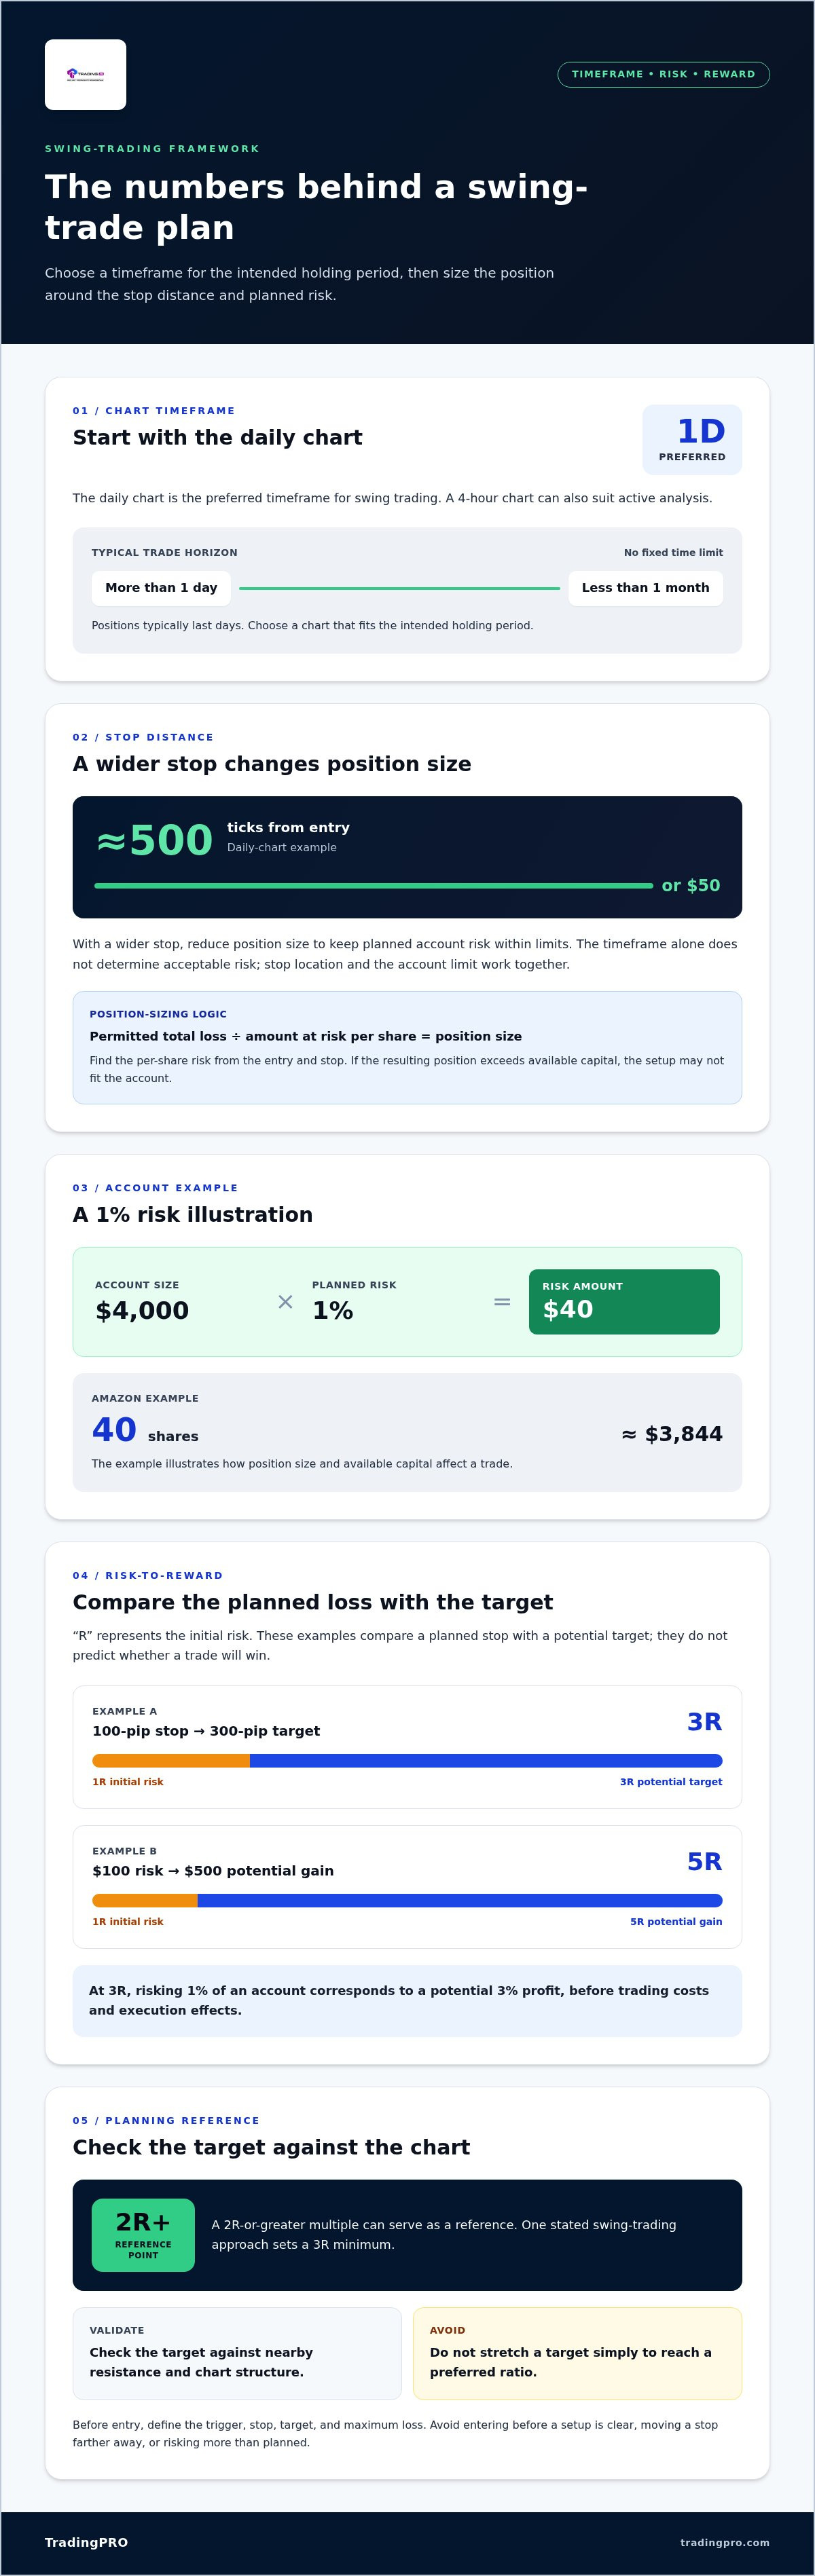
The daily chart is the preferred time frame for swing trading, while a 4-hour chart can also suit active analysis. Swing trades generally last longer than one day and less than one month, though positions typically last days without a fixed time limit. Choose a chart that fits your intended holding period, then set the risk before entering.
Risk management begins with the stop-loss distance, not the number of shares or contracts. A daily-chart example places the stop roughly 500 ticks, or $50, from entry. That wider distance means a trader must reduce position size to keep the planned account risk within limits. A chart’s timeframe doesn’t determine acceptable risk by itself; the stop location and account limit work together.
For example, risking 1% of a $4,000 account equals $40. In an Amazon example, buying 40 shares would cost around $3,844, illustrating how position size and available capital affect the trade. Calculate the amount at risk per share from the entry and stop, then divide the permitted total loss by that amount. If the resulting position is too large for available capital, the setup may not fit the account.
Risk-to-reward ratios compare the planned loss with the potential gain. A setup with a 100-pip stop and a 300-pip target has a 3R ratio: the target is three times the initial risk. A $100 risk with a potential $500 gain represents 5R. At 3R, risking 1% of an account corresponds to a potential profit of 3%, before trading costs and execution effects.
These ratios don’t predict whether a trade will win. They help traders assess whether a target justifies the stop distance. A 2R or greater multiple can serve as a reference point, while one stated swing-trading approach sets a 3R minimum. Check the target against nearby resistance and the chart’s structure; don’t stretch it simply to reach a preferred ratio.
What are the risks and common mistakes of swing trading from daily charts? A wide stop can create excessive exposure if you leave position size unchanged, while a distant target can make a trade unrealistic. Common errors include entering before a setup is clear, moving a stop farther away, and risking more than your plan allows.
Before entry, write down the trigger, stop, target, and maximum loss. If the planned reward does not justify the risk, skip the position rather than forcing the setup. Once those rules are set, you can put your trading plan into practice.
3. Trading support and resistance
Support is an area where buying has previously slowed or reversed a decline. Resistance is an area where selling has checked an advance. On a daily chart, mark these zones around visible turning points, not every small candle fluctuation. A zone captures price action more realistically than a line, because reversals can occur across a range rather than at one exact price.
Begin by scanning left across the chart. Note where price repeatedly stalled, bounced, or reversed, then extend those areas toward the current candles. Give more weight to levels that caused a clear reaction and remain relevant to the current trend. The price action around a level matters: a strong close beyond resistance shows different behavior from a brief move above it followed by a close back below.
For a long trade, the stock should be trending and have a well-defined support or resistance level. In the Apple example, a possible long-trade area is around $193–$196 per share. An aggressive long-entry area based on a previous resistance level is $190–$194 per share. These are example zones, not automatic buy signals. Read the daily candles as price approaches, and decide what price action would support or invalidate the setup.
The /ES market found support around $2,840 after a heavy sell-off in late July. That example shows why context matters: a level becomes useful when traders can connect it to a visible market response. If price returns to support, watch whether selling pressure fades or candles continue closing lower. A level that fails to hold can change roles, with former support acting as resistance during a later recovery.
- Mark the zone: Use the daily chart’s clearest turning points to outline support and resistance.
- Check the approach: Compare the latest candles with the direction into the Apple or /ES zone.
- Define the trigger: Decide what closing behavior or rejection would qualify as a trade signal.
- Plan the exit: Identify the next opposing zone before entry, since resistance can limit a long trade’s room to advance.
A breakout needs a plan, not an assumption. If a daily candle closes above resistance, assess whether price holds beyond the zone or quickly returns below it. A retest that respects former resistance may offer a clearer decision point than chasing the first sharp move. If price closes decisively through support, reassess the long setup rather than treating the old zone as unchanged.
Use support and resistance to organize a trade, not to predict every turn. Mark the zones, observe the daily price action, and set entry and exit conditions before taking a position. This keeps chart patterns tied to specific market levels.
4. Comparing daily, four-hour, weekly, and hourly charts
Use timeframes as a hierarchy, not as competing signals. Start with the weekly chart to judge the broad market direction, then move to the daily chart to assess the swing structure. Add a four-hour or hourly chart only if you need to examine the setup more closely. This sequence keeps a short-lived move from overshadowing the larger trend.
The weekly chart can help with analysis for a potentially extended holding period. A position based on a weekly setup can remain open for months, so its price swings and exit plan may differ from those of a trade planned around daily candles. The weekly view helps identify the broader trend, while the daily view shows whether price is forming a manageable pullback or breaking that structure.
The daily chart is the preferred timeframe for swing trading because it balances trend context with actionable detail. Each candle summarizes a full trading day, making the chart useful for comparing consecutive closes, daily highs, and daily lows. Use it to map the setup and its key decision points. Then ask whether a four-hour view adds clarity or merely introduces smaller fluctuations.
A four-hour chart can help refine a daily setup without changing its larger premise. Traders who use a four-hour chart and work down to a 15-minute chart are likely to hold a trade for a few days at most. That combination prioritizes short-term execution. If the plan requires holding beyond that window, return to the daily and weekly charts before acting on an intraday move.
An hourly chart shows more detail than a four-hour chart, but that detail can make routine price movement seem decisive. Use it to observe how price behaves near a daily level, not to replace the daily trend assessment. A move that looks like a breakout on an hourly chart may remain a small fluctuation on the daily chart. Match each timeframe to the decision it supports.
- Weekly: Establish broad direction and assess setups intended for longer holding periods.
- Daily: Define the swing structure and evaluate whether the setup remains intact.
- Four-hour: Add detail for trades planned around a shorter holding period.
- Hourly: Inspect near-term price action without allowing it to override higher-timeframe context.
For a potentially extended holding period, compare weekly, daily, and four-hour charts together. If their signals conflict, decide which chart governs your trade plan before entering. Markets can move differently across timeframes because each candle covers a different span. Matching the chart to your intended holding period keeps your analysis focused and helps prevent an hourly signal from dictating a longer-term decision.
5. Choosing daily charts for swing trading
Using daily charts for swing trading gives each candle room to show a full day’s price action, helping you focus on the larger move instead of reacting to every intraday fluctuation. Choose this timeframe when your strategy depends on multi-day structure, clear levels, and planned holding periods. Use smaller charts to refine a decision, not to replace the daily setup.
Which indicators work best on daily charts for swing trading? No single indicator works best in every market. Start with price action, support and resistance, and trend direction. Moving averages or volume can add context, but they shouldn’t replace a clear entry rule.
How do swing traders use daily charts? They identify the broader direction, mark decision areas, and wait for a setup to meet defined entry conditions. For example, a trader can plan around a daily breakout, then record the trigger, stop location, and exit condition before opening a position.
Keep the chart uncluttered. If several indicators give conflicting signals around the same support zone, return to the price structure and ask what would invalidate the setup. A moving average may help visualize trend direction, while volume can show participation around a breakout. Treat each tool as evidence to assess, not as an automatic buy or sell command.
Earnings announcements, economic news, and overnight gaps can change a daily setup before the next session opens. A stock may open beyond a planned entry or stop after an earnings release, while broader economic news can shift market direction across multiple assets. Note scheduled events before entering, and account for the possibility that an overnight move may differ from the previous day’s close.
For beginners, build one written plan around a single setup, such as a trend pullback or breakout. Define the chart conditions, entry trigger, stop, target, and reasons to skip a trade. Then replay historical daily charts and record every setup that meets those rules, including losing trades and gaps. Evaluate the results against the same rules rather than adjusting them after each example.
Keep the test consistent: use the same entry and exit logic throughout, and include realistic trading costs in your review. Note whether the setup follows the broader direction and whether nearby resistance limits the target. If a rule depends on judgment, write down what qualifies before reviewing more charts. This makes it easier to distinguish a repeatable strategy from a pattern noticed only after a move.
Turn your written rules into a practical routine: put your daily-chart trading plan into practice.
TradingPRO: Rookie Account
TradingPRO’s Rookie Account gives traders an account option for putting a structured approach to the markets into practice. Use the daily-chart process in this guide to define your setup, entry, stop, and target before making trading decisions. The account doesn’t replace a plan or remove market risk; position size and trade rules remain central.
As your approach develops, TradingPRO also offers Micro, Pro, and Scalp Accounts. Choose the account tier that fits your trading style and needs, and keep your chart analysis consistent with your risk plan.
Visit tradingpro.com to explore the Rookie Account.
Build a More Deliberate Trading Routine
Make your next chart review a deliberate practice session, not a search for action. The value of using daily charts for swing trading comes from applying the same decision process consistently, even when a setup looks compelling. Record why you considered a trade, what would change your view, and whether your eventual action matched your written plan. Over time, this record can help you spot where your judgment stays disciplined and where it drifts.
Keep the routine manageable and focused. Review a chart, define your conditions, and wait for the market to meet them. Passing on a trade is also a decision. A clear process gives you a stronger basis for refining your approach than changing strategies after every outcome.
If you’re ready to take your next step with TradingPRO, begin your registration. Stay patient, stay consistent, and keep building your trading skills.
Frequently Asked Questions
What is the Best Time Frame for Swing Trading?
The daily chart is the preferred timeframe for swing trading, while a 4-hour chart can also suit the approach. Swing trades generally last longer than one day and less than one month, although positions often last days without a fixed time limit. Choose based on how long you plan to hold and how much detail your decisions need. A weekly chart can provide context, but positions based on it may remain open for months.
How should swing traders set stop-loss and profit targets using daily charts?
Set the stop where the daily-chart setup would no longer be valid, then choose a target around the next meaningful price barrier. For a long trade, that may mean placing the stop below the support structure and assessing resistance above the entry. Check that the distance to the target makes sense against your planned loss. Overnight gaps can move price past either level, so account for that exposure in your plan.
How much capital and risk per trade is typical for swing trading?
There’s no single capital amount that fits every swing trader; position size depends on account balance, stop distance, and the market being traded. One example uses a $4,000 account and a 1% risk limit, equal to $40 of planned risk. Calculate the position from the loss that would occur if the stop is reached. A wider stop calls for a smaller position if the planned risk stays unchanged.
How do daily charts compare with hourly and weekly charts for swing trading?
A daily chart helps assess multi-day price structure, while an hourly chart shows more short-term movement. The weekly chart gives a broader view, and a setup based on it may keep a position open for months. Traders combining a 4-hour chart with a 15-minute chart are likely to hold trades for a few days at most. Match the timeframe to the intended holding period, and use lower charts for detail rather than broader direction.


