




- Published on: 2026-10-23 10:17:13
Trading Breakouts Successfully by Reading Price Levels and Traps

A move beyond a price level can look like a clear signal, but the break alone doesn’t tell the whole story. A breakout occurs when price moves above resistance or below support. A candle close beyond the level, stronger volume, and a retest can help distinguish a sustained move from a false signal. Trading breakouts successfully means assessing that context before deciding whether to act.
It’s natural to want to catch a strong move early. But entering before a breakout is confirmed can leave you exposed when price quickly reverses. Waiting for context can help you judge the setup more carefully.
This guide explains how breakouts form, how trend breaks differ from support or resistance breaks, and how to recognize common traps. You’ll also see how the same principles apply across stocks, indices, commodities, and currencies, so you can assess each chart on its own terms.
Key Takeaways
- Distinguish orderly consolidations from choppy price action by watching how clearly the range holds and whether momentum begins to build.
- Wait for a candle to close beyond support or resistance, then assess volume and a possible retest before treating the move as confirmed.
- Use trend direction to identify continuation setups, while recognizing that a breakout against the prevailing trend may signal a potential reversal.
- Apply the same price-level principles across stocks, indices, commodities, and currencies, while assessing each market’s own chart behavior.
- Plan an exit point before entering; a breakout can fail, so disciplined risk management matters as much as the entry signal.
What is a breakout trading strategy and how do you trade with it?
A breakout strategy seeks to trade a strong move beyond a defined price range or pattern. The setup matters: a clear consolidation, a closing signal, and a planned exit help distinguish a trade from a guess.
Reading Consolidation Conditions
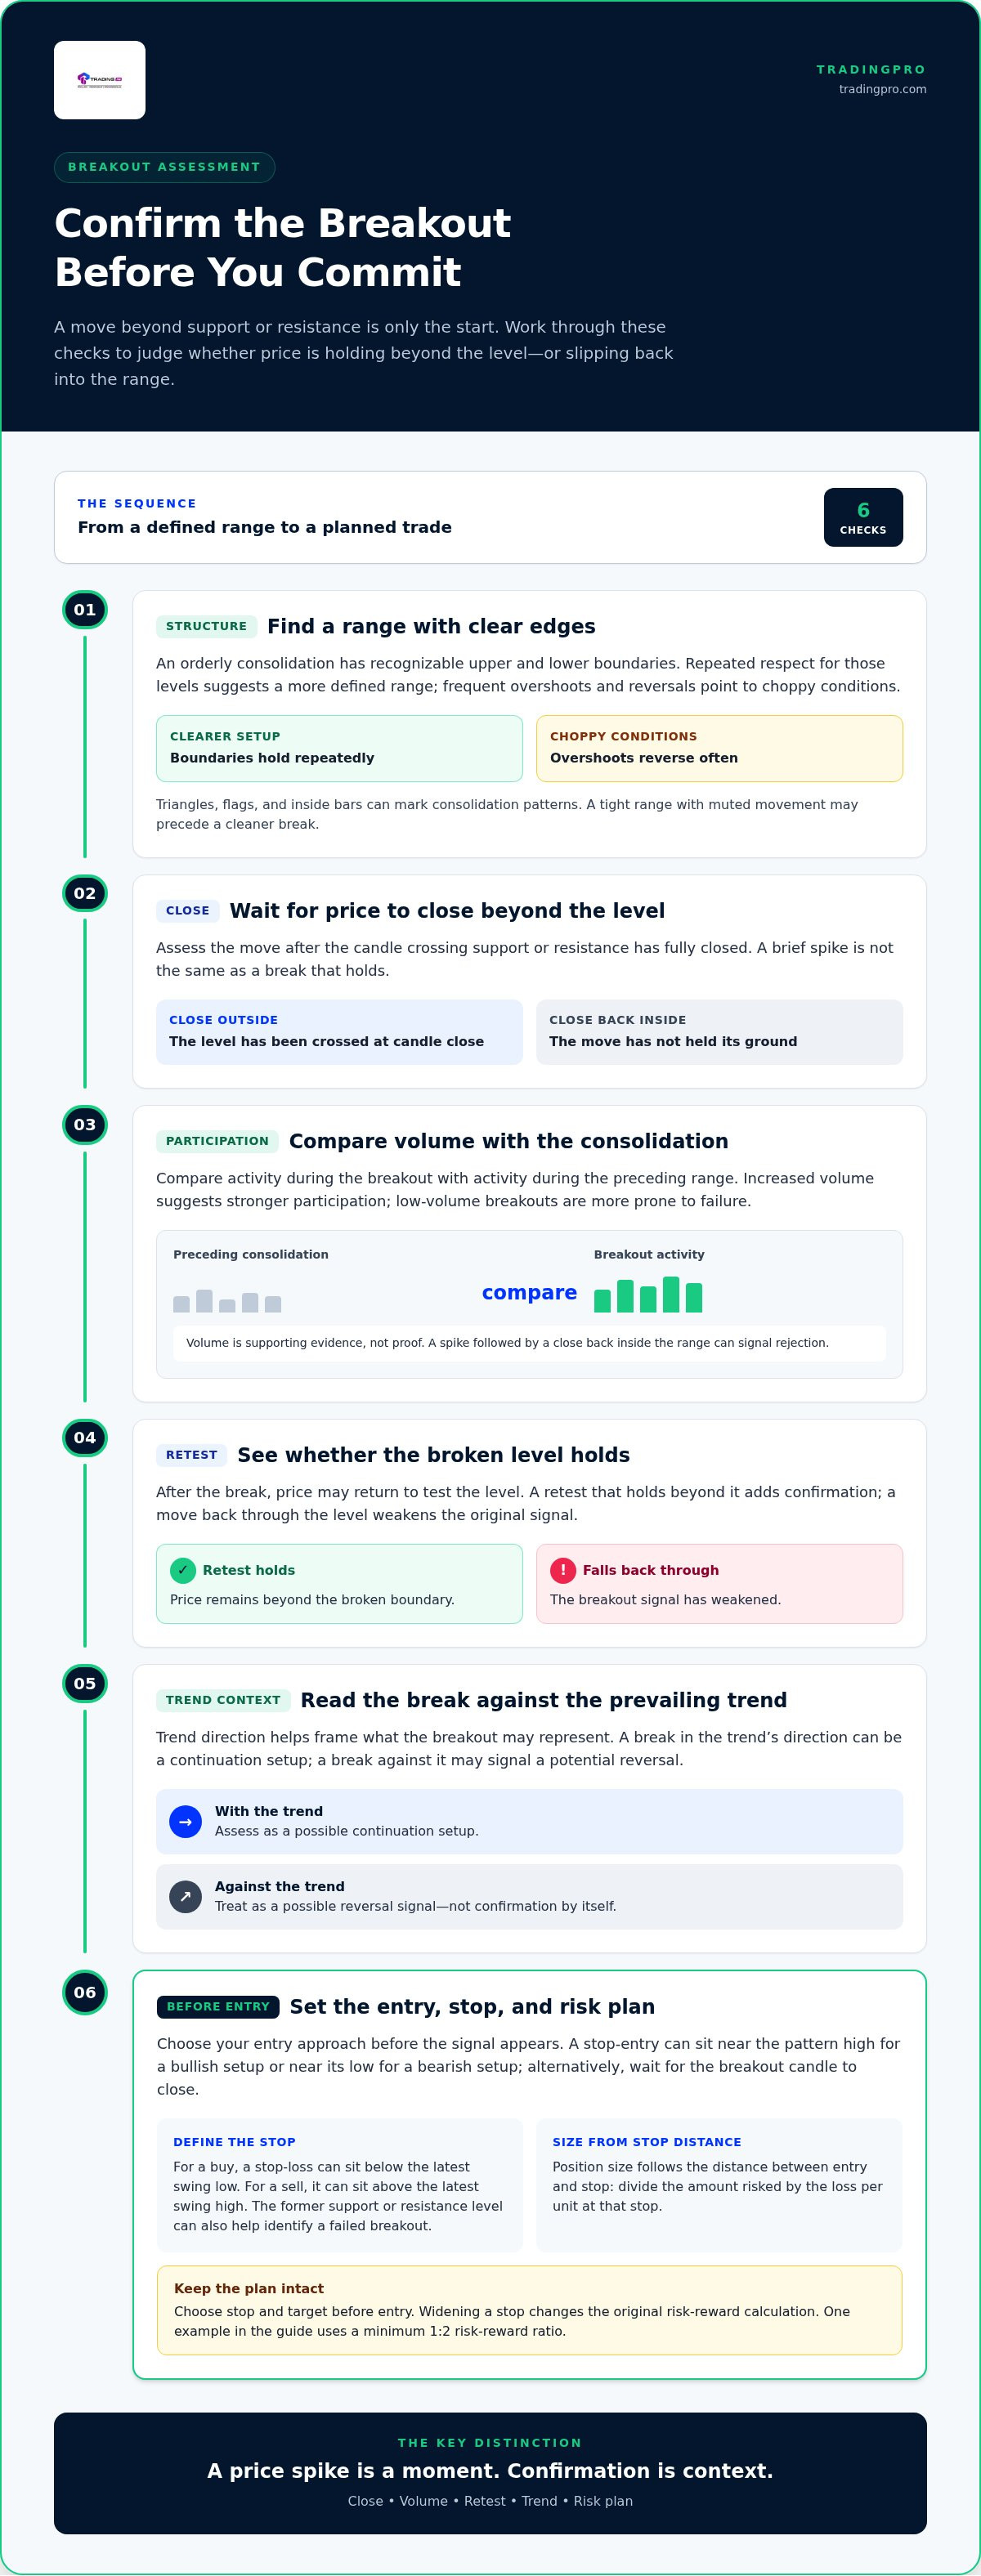
An orderly consolidation is a contained price range with recognizable upper and lower boundaries and moderate volatility. That structure matters because a close beyond a clear edge gives you a defined signal to assess.
Compare recent highs and lows: repeated respect for the same boundaries suggests order, while frequent overshoots and reversals suggest choppy conditions. A tight range with muted movement may precede a cleaner break. Triangles, flags, and inside bars can mark consolidation patterns. An inside bar breakout occurs when price leaves the inside bar’s range.
Use RSI as supporting context, not as a standalone trigger. RSI staying in the middle of its range can indicate limited momentum, while candles extending in one direction may signal rising momentum after a break. This contrast can help you avoid entries in messy ranges where price repeatedly crosses both edges.
Using Stop-Entry Orders
A stop-entry order instructs the platform to open a trade if price reaches a specified level beyond a pattern’s high or low. It can help you participate when price moves through a boundary, rather than entering while the consolidation still holds.
For a bullish setup, place a buy stop near the pattern’s high; for a bearish setup, place a sell stop near its low. Alternatively, wait for the candle crossing the breakout level to close, then enter. Choose your approach before the signal appears, and don’t shift the entry simply because price is moving quickly.
A stop-entry order doesn’t replace an exit plan. Set the intended stop-loss level before entry, since a brief move beyond the range can reverse and trap late orders.
Managing Trade Risk and Exits
Risk management defines potential loss and exit conditions before a trade opens. A stop-loss can sit below the latest swing low for a buy trade, or above the latest swing high for a sell trade. The former support or resistance level can also help identify where a losing breakout has failed.
Position size follows the distance between entry and stop: divide the amount risked by the loss per unit at that stop. Risk-reward compares that potential loss with the planned profit; one breakout example uses a minimum 1:2 ratio. Stop-loss and take-profit orders can keep the plan visible when emotions push a trader to hold, exit early, or chase.
Choose your stop and target before entry, then calculate position size from the stop distance. Don’t widen a stop to avoid accepting a planned loss: doing so changes the original risk-reward calculation.
Testing Strategy Performance
Backtesting applies the same entry, stop, and exit rules to historical price data, one setup at a time. Record each trade’s result, including losses, across the assets and chart conditions the strategy is intended to address. Keep the rules consistent so the results reflect the setup, not hindsight decisions.
Calculate the win rate by dividing winning trades by total trades. Measure expectancy by multiplying the win rate by the average win, then subtracting the loss rate multiplied by the average loss. Expressing results in risk units makes outcomes easier to compare. Include realistic execution assumptions, then review losing trades for recurring failure conditions.
Trading breakouts successfully takes more than a high win rate: compare expectancy and drawdowns, then test the rules on data not used to build them. This helps distinguish a repeatable approach from a pattern that only looked convincing in hindsight.
Avoiding false breakouts and bull traps
A move beyond a range can reverse quickly, turning an apparent signal into a trap. Before acting, confirm direction with the candle close, volume, and price behavior around the broken level.
Recognizing False Breakouts
A false breakout occurs when price briefly moves beyond support or resistance, then returns inside the range. A bull trap is an upside false breakout: buyers enter above resistance, but price reverses and exposes them to losses.
Watch what happens after the boundary breaks. If the candle closes back within the range, the move hasn’t held its ground. An inside bar false breakout is known as a fakey. Recognizing the reversal helps you avoid treating every brief overshoot as a change in direction.
Impatience can be costly. Don’t react to the first price spike; wait for the candle to close fully outside the range. If price then retests the level and holds beyond it, that offers additional confirmation. If it falls back through, the original breakout signal has weakened.
Using Volume Confirmation
Volume confirmation means comparing activity during a breakout with activity during the preceding consolidation. A move beyond a level on increased volume suggests stronger participation than a similar move on low volume.
Low-volume breakouts are more prone to failure, and price may be more likely to retrace. Treat volume as supporting evidence, not proof: compare it with recent activity and check whether price remains beyond the boundary after the candle closes. A volume spike followed by a close back inside the range can signal rejection.
Combine volume with a retest, trendline, or moving average instead of relying on a single indicator. For example, a resistance break on increased volume followed by a retest that holds as support gives you more context than a brief price jump alone.
Accounting for Volatility Risks
Volatility describes how sharply price moves and how wide its swings become. It matters because a fast, wide move can cross a level and reverse before you can assess whether the breakout is holding.
In a choppy range, repeated overshoots can trigger entries in both directions. Avoid forcing a trade when price repeatedly crosses the range boundaries or technical signals conflict. Waiting is a valid choice: breakout strategies don’t require a position during every market move.
Plan the stop-loss before entry, placing it where the breakout idea is invalidated, such as back inside the broken range. Higher volatility may require a wider stop, so reduce position size to keep planned risk controlled. Don’t move the stop farther away simply to avoid closing a losing trade.
Make confirmation part of the plan, not an impulse. Once your entry and risk rules are clear, you can set up a trading account to put that disciplined approach into practice.
Trend-continuation breakouts
A continuation breakout occurs when price leaves a consolidation in the direction of an established trend. These strategies tend to have clearer context in trending markets; ranging markets often produce less directional follow-through and more competing signals.
Continuing an Existing Trend
A trend-continuation breakout is a move out of a pause that resumes the prevailing trend. It matters because a pullback can offer a structured re-entry, rather than requiring you to chase an earlier price move.
In an uptrend, look for a pullback followed by consolidation that doesn’t make a lower low. That pause may offer a potential re-entry or a chance to add to an existing position. In a downtrend, assess whether price pauses before continuing lower, rather than assuming every rebound marks a reversal.
Read the pause alongside the trend’s sequence of highs and lows. An uptrend retains higher swing highs and higher swing lows; a consolidation that preserves this structure supports a continuation thesis. If price breaks against the trend and changes that structure, the original setup weakens. Momentum matters, but the pattern of price movements provides essential context.
Compare the breakout candle with the consolidation candles. A close in the trend’s direction, especially with increased volume, provides stronger evidence of renewed participation than a brief intrabar move. Moving averages and candlestick patterns can add context, but they shouldn’t replace the directional structure visible on the chart.
Breaking Horizontal and Trend Lines
A horizontal breakout clears a range boundary, while a trendline breakout crosses a diagonal line connecting swing points. Distinguishing between them helps you define which structure has changed and what would invalidate the signal.
For a horizontal setup, mark the range ceiling in an uptrend or its floor in a downtrend. Then assess whether a close beyond that boundary aligns with the prevailing direction. A break in the opposite direction may signal a reversal, so don’t label every boundary crossing a continuation.
A trendline breakout strategy tracks a line drawn through relevant swing lows in an uptrend or swing highs in a downtrend. Treat a candle close beyond the line as the signal, with increased volume adding confirmation. A wick through the line followed by a close back within the trend structure is weaker evidence.
Trendlines are interpretations, not fixed market barriers. If different swing points create sharply different lines, the signal is less clear. Keep the line consistent, check it against support and resistance, and define the invalidation point before entry. In a range without a clear directional sequence, step aside rather than forcing a trend-continuation trade.
Breakouts at support and resistance
Support and resistance mark areas where price has previously stalled or turned. A breakout occurs when price moves above resistance or below support, changing the level’s role and potentially signaling continuation or reversal.
Breakouts at Support
A support breakout occurs when price falls below a level that previously attracted buyers. It matters because a decisive break can reveal weakening demand and create a bearish setup.
Identify support levels from historical price data, focusing on areas where price repeatedly paused or bounced. Treat the level as a zone, not a perfectly precise line: markets can move through it briefly before choosing direction. A bearish example uses EUR/USD breaking below support at 1.03500. The close below the zone gives more context than a temporary dip beneath it.
After the break, observe whether price returns to test the former support. If that area now acts as resistance, sellers may be defending the new structure. A close back above the level, however, weakens the breakdown thesis and can signal a reversal. Define the point that invalidates the setup before entry, then size the position around that risk.
A support-break strategy shouldn’t treat every lower price as a breakdown. Compare the move with the broader chart: a break from a clear range differs from a small dip during noisy price action. If repeated overshoots make the support zone unclear, standing aside is more disciplined than forcing a technical signal.
Breakouts at Resistance
A resistance breakout occurs when price rises above an area where sellers previously capped advances. It matters because former resistance can become support, giving you a level to assess after the move.
Mark resistance using historical swing highs and repeated pauses. In a bullish example, EUR/USD breaks above resistance at 1.0200. A close beyond the level provides a clearer signal than an intraday wick, while increased volume can help assess participation. The breakout is not the whole setup; the response around the level matters too.
If price retests the broken resistance and holds above it, the former ceiling is acting as support. If price slips back below and stays there, the breakout may have failed. Place the invalidation point where the original idea no longer holds, and avoid widening a stop simply because price reverses.
Key levels can also frame reversal trades. In one example, a price action pattern breaking from major resistance led to a down move lasting more than a month. This illustrates why context matters: a break away from resistance may signal a change in direction, while a break aligned with an established trend may indicate continuation.
For either direction, map the level, wait for price to close beyond it, then assess the retest and the area’s new role. Old resistance should act as new support after an upside breakout; old support should act as new resistance after a downside break. If price fails to respect that shift, reassess the trade rather than defending the initial signal.
Breakout trading across asset classes
Breakout trading can apply to stocks, indices, commodities, and currencies, but chart context differs across markets. Keep the core method consistent, then adapt your position and confirmation criteria to the asset’s price behavior and trading conditions.
For an individual stock, a breakout may follow a pause near a historical high. Check whether the move holds beyond that level and whether trading activity supports the direction. A gap can complicate entry: price may open beyond resistance, leaving no orderly test of the boundary. In that case, define the invalidation level before acting instead of chasing the opening move.
With an index, assess the broader price structure as well as the index chart. A bullish break from consolidation can align with an advancing trend, while a move that conflicts with the surrounding structure calls for more caution. Compare the breakout candle with nearby candles, then decide whether the signal supports a new position or simply warrants observation.
Commodity charts also require attention to the specific contract and its price history. A level on one contract may not map neatly onto another. Mark support and resistance on the chart you intend to trade, then judge the break against that instrument’s own consolidation, momentum, and volume. Don’t transfer a signal from one commodity to another without reassessing the setup.
Currency pairs offer another clear example. In an intraday EUR/USD example, price breached the previous day’s high of 1.08922 on the next trading day. The level provides a reference, not a guarantee of follow-through. A trader can assess whether price holds above it, whether momentum supports the bullish direction, and where a reversal would invalidate the planned trade.
Across all four asset classes, separate the chart signal from the instrument’s risk. A stop-loss defines the exit if price moves against your thesis; position size should reflect the distance to that exit. With CFDs, leverage can magnify both gains and losses, and you may lose more than the initial deposit used to open a position. Account for that exposure in your plan before taking action.
The key is to adapt the same trading strategy rather than copy identical settings across markets. Use each asset’s own levels, confirm the break on its chart, and skip unclear price action. To put your approach into practice, open a trading account.
TradingPRO: Rookie Account
TradingPRO’s Rookie Account is a natural starting point if you want to put breakout concepts into practice in a trading account. Use the framework in this guide to assess price levels, wait for confirmation, and plan entry and exit decisions before taking a position.
Choose an approach that matches your experience and trading style. TradingPRO also offers Micro, Pro, and Scalp Accounts, providing other account options to consider as your needs evolve. A breakout signal still requires your own analysis and risk plan; an account doesn’t remove market risk or guarantee a result.
Explore the Rookie Account to decide whether it fits your next step. Contact TradingPRO or visit its website to learn more.
Make Your Next Move With a Clear Plan
A disciplined approach to trading breakouts successfully begins before the next signal appears. Decide what evidence would change your view, how much risk you’ll accept, and when you’ll stay out. That preparation turns each chart into a decision process, not a demand to trade every move.
Keep refining your process across the markets you follow. Record why you entered, what confirmed the setup, and whether the exit followed your plan. Over time, those notes can reveal which conditions suit your approach and where your rules need more precision. Your edge comes from repeatable decisions, not from forcing certainty onto an unpredictable market.
TradingPRO offers Rookie, Micro, and Pro Accounts for traders considering their next step. Choose the approach that fits your trading needs, and keep your risk plan at the center of every position.
Explore your trading options with TradingPRO, then move forward with focus and discipline.
Frequently Asked Questions
What Is a Breakout?
A breakout is a move beyond a price boundary traders are watching, such as a range edge or chart pattern. The timeframe matters: a brief move outside a boundary on a short chart may look different from a close beyond it on a longer chart. Compare the breakout candle with the surrounding price structure before deciding whether the move changes the market’s direction.
What is a resistance level?
A resistance level is a price area where selling has previously slowed or stopped upward movement. Traders often identify it by comparing prior swing highs and repeated pauses. Treat resistance as an area rather than an exact line, since price can turn at slightly different levels. A resistance zone on a longer-term chart can also provide context for a shorter-term trade, but it doesn’t determine the next move by itself.
What is a support level?
A support level is an area where buying has previously interrupted or slowed a decline. Identify it by examining historical lows and places where price repeatedly bounced. For instance, if price approaches a prior low after a gradual pullback, watch how it behaves there rather than assuming support will hold. A decisive move through the area changes the setup and calls for reassessing the original trade idea.
What is a breakout trading strategy?
A breakout trading strategy sets rules for acting when price moves beyond a defined range, pattern, or key level. It can target continuation in the direction of an established trend or a possible reversal away from a major level. A practical plan specifies the chart condition, entry trigger, invalidation point, and exit approach before the signal appears. This structure helps you compare similar setups instead of making decisions from isolated candles.
How do traders identify valid support and resistance breakouts?
Assess whether price has moved decisively beyond a clearly defined area, then examine the candle close and what follows. For example, if price breaks resistance but quickly falls back beneath it, the level hasn’t clearly changed roles. A retest that holds above former resistance adds context to a bullish setup. Compare the signal with the broader trend, and don’t treat a single wick as sufficient evidence.
Which indicators help confirm a breakout, such as volume or ATR?
Volume can show whether participation increased as price crossed a boundary. Moving averages, trendlines, candlestick patterns, and MACD can add context about trend or momentum. ATR, or Average True Range, measures recent volatility rather than breakout direction. It can help you judge whether a candle’s movement is large relative to recent price action, but it doesn’t confirm whether a bullish or bearish trade is appropriate.
How can traders avoid false breakouts and bull or bear traps?
Wait for evidence that price can hold beyond the boundary instead of reacting to the first spike. A bull trap occurs when an apparent upside break reverses; a bear trap reverses after an apparent downside break. Check the candle close, volume, and response around the level. An inside-bar false break, called a fakey, is another reason to distinguish a brief overshoot from a sustained move.
What are the steps for entering and exiting a breakout trade?
First, mark the boundary and define what counts as a breakout on your chosen chart. Next, choose whether to enter after a candle closes beyond it or use a stop-entry order near the pattern’s edge. Before placing the order, set the stop-loss where the trade idea fails and identify a take-profit condition. After entry, follow those exit rules rather than changing them in response to emotion.


