




- Published on: 2026-11-09 18:24:02
Micro Account Drawdown Tolerance and How to Calculate It

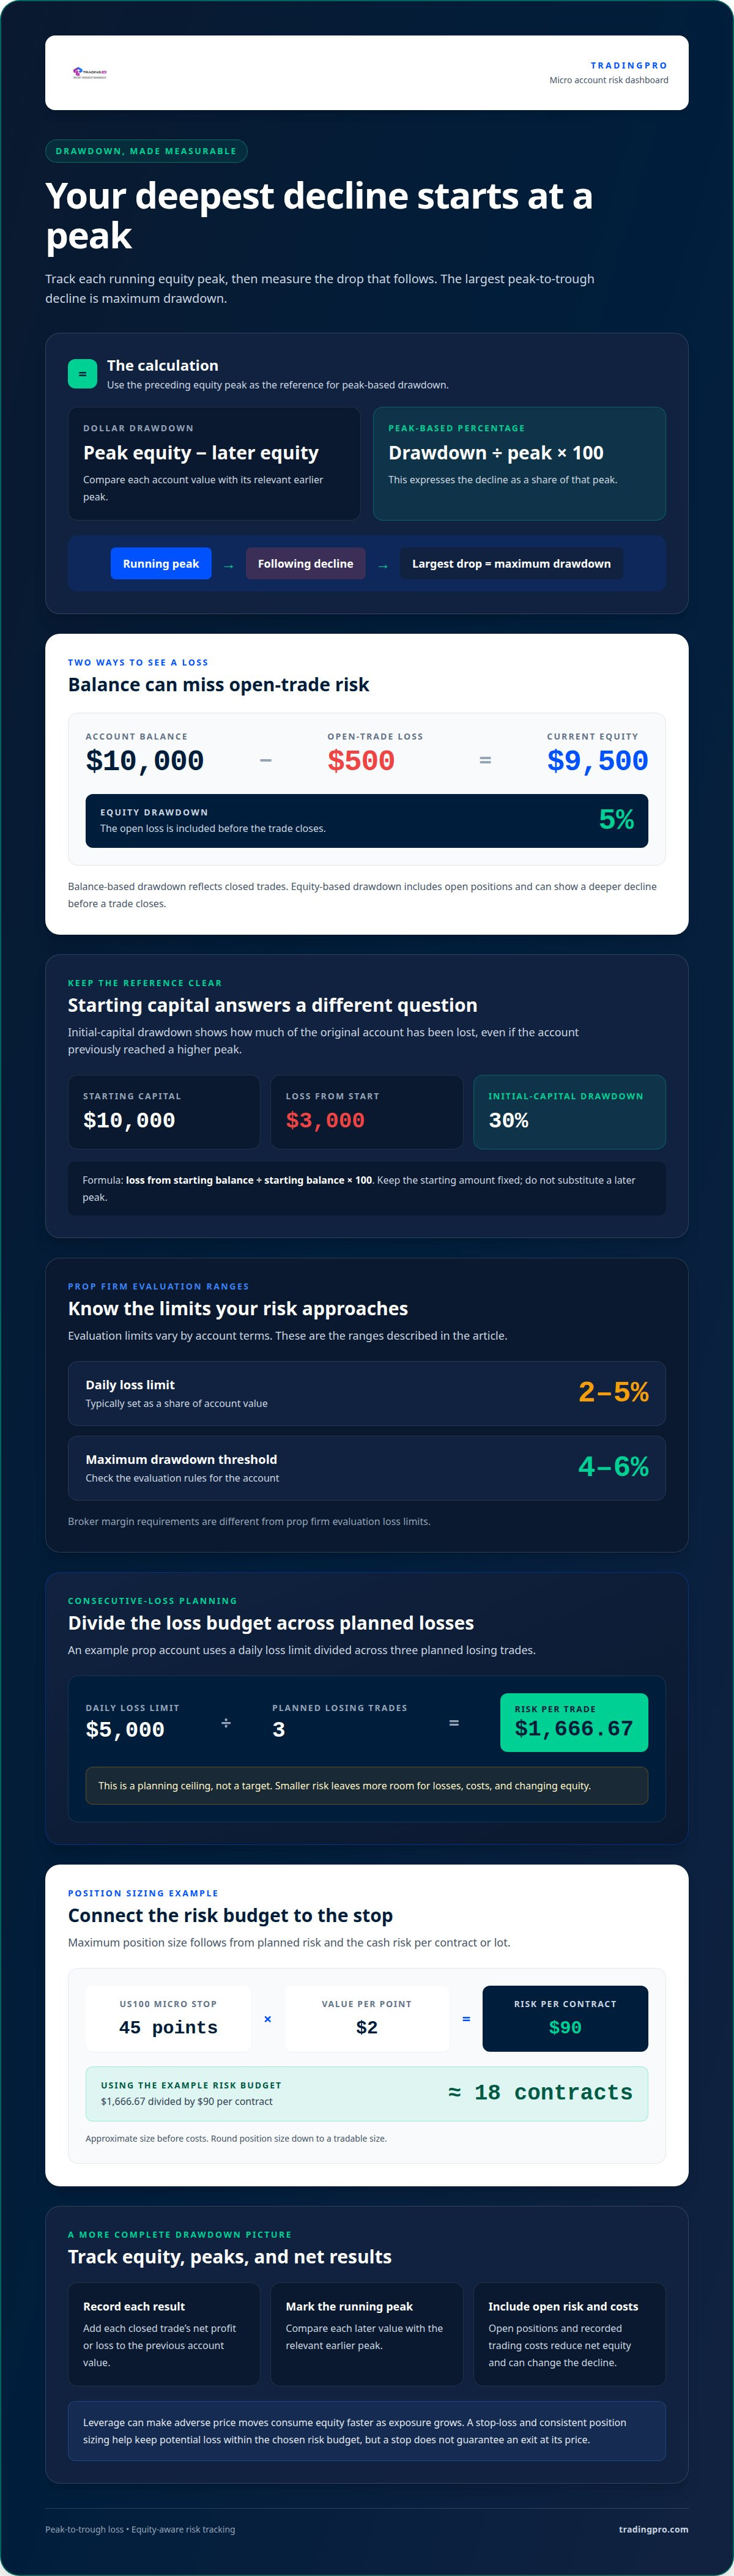
Your account’s survival depends on the loss it can absorb, not just the balance it starts with. A micro account drawdown tolerance calculation tracks the running equity peak, measures each decline as a percentage of that peak, and identifies the largest drop. For example, a $10,000 balance with a $500 open-trade loss has $9,500 in equity, an equity drawdown of 5%.
It’s easy to focus on the dollar loss, but the percentage shows how much of your account is at risk. The two measures can tell different stories, and open losses matter even before a trade closes. This guide explains how to calculate maximum drawdown in dollars and as a percentage, distinguish balance drawdown from equity drawdown, and assess whether your account can tolerate the losses a strategy may produce. It also explains why the sequence of wins and losses, and the time needed to recover, matter when evaluating account resilience.
Key Takeaways
- Track the account’s running equity peak to identify the largest peak-to-trough decline, rather than relying only on the ending balance.
- Use consecutive-loss planning to set risk per trade within a prop account’s daily loss limit.
- Measure losses against initial capital to see how much of the starting account has been depleted.
- Account for recovery: a loss reduces the capital available to rebuild toward the previous peak.
- Assess drawdown tolerance by considering both the size of a decline and how long the account may take to recover.
How do you calculate maximum drawdown?
Track account values over time, mark each running peak, and measure every decline that follows. The largest peak-to-trough decline is the maximum drawdown.
Starting-Balance Drawdown Percentage
An initial-capital drawdown expresses a loss as a percentage of the account’s starting balance. Divide the loss by that starting balance, then multiply by 100. For example, a $3,000 loss from $10,000 initial capital equals 30%. This metric shows how much of the original funds have been lost, even if the account previously reached a higher peak. Keep it distinct from peak-based maximum drawdown, which uses the preceding equity peak as its reference.
Balance-Based and Equity-Based Drawdown
Balance-based drawdown measures declines in closed-trade account balance; equity-based drawdown includes open positions. For example, a $10,000 balance with a $500 open-trade loss has $9,500 equity, an equity drawdown of 5%. Equity can therefore show a deeper decline before a trade closes. Use the measure that reflects the risk you want to assess.
Using Starting Balance and P&L Data
The starting balance is the baseline for turning a profit-and-loss series into account values. Add each period’s profit or loss to the previous value, then compare the resulting account values. To find maximum drawdown, track each peak along the way. Measure a later loss against the relevant earlier peak, not automatically against the starting balance.
Lot Size and Pip Value Effects
Lot size determines position exposure, while pip value shows the monetary effect of each pip movement for that position. An adverse move creates a larger dollar loss when the position’s pip value is higher, increasing drawdown against account equity. Calculate the loss by multiplying the adverse pip movement by the position’s pip value. This links position sizing directly to how much account capital a trade can consume.
Compare the largest dollar decline and the largest percentage decline across the same account history. They may occur in different drawdown episodes: dollar losses depend on account size, while percentage losses are measured against each peak. For a funded or personal micro account, record equity as well as balance when open trades matter. This gives a clearer picture of both the deepest decline and the share of capital it represents.
What Is Drawdown on a Prop Firm Account?
In a prop firm account, drawdown measures losses against the account’s peak or starting value. Risk per trade matters because consecutive losses can bring equity closer to the firm’s loss limits.
Prop firm evaluations typically set daily loss limits of 2-5% of account value and maximum drawdown thresholds of 4-6%. Forex broker drawdown rules vary by account terms; distinguish a broker’s margin requirements from a prop firm’s evaluation limits.
Risk Across Consecutive Losses
Risk per trade is the planned loss if a position reaches its stop, and consecutive losing trades compound that pressure. For an example prop account with a $5,000 daily loss limit, dividing the limit across three planned losing trades gives $1,666.67 risk per trade. This is a planning ceiling, not a target. Smaller risk leaves more room for losses, costs, and changing equity.
Calculating Drawdown from a Trade Log
A trade log helps reconstruct account equity after each result and identify the largest peak-to-trough decline. Start with the opening value, add each closed trade’s net profit or loss, and record the running peak. Compare every later value with that peak. Include commissions and other trading costs in net results; otherwise, the log understates the decline and overstates the remaining loss allowance.
Risk per Trade and Account Survival
Maximum position size follows from the loss budget and the amount at risk per contract or lot. Divide planned risk per trade by the cash risk from one position at its stop, then round down to a tradable size. In the example, a US100 micro contract with a 45-point stop at $2 per point risks $90 per contract. A $1,666.67 risk budget allows approximately 18 contracts before costs.
Leverage lets a smaller deposit control a larger position, so an adverse price move can consume equity faster as exposure grows. Set a stop-loss at the point where the trade idea is invalidated, then size the position so the potential loss at that stop fits your chosen risk budget. A daily loss limit caps further planned risk for the period, but it does not remove market risk or guarantee an exit at the stop price.
Trade-by-Trade and Daily Equity
Trade-by-trade records capture closed results, while daily equity also reflects open positions at the time of measurement. Daily or intraday equity that includes open positions gives a more realistic drawdown measure; closed-trade equity can understate losses while trades remain active. Compare both views when tracking limits. Include spreads, swaps, fees, and slippage as costs that reduce net equity, using the actual amounts recorded for each position.
Consistent position sizing and complete records make a drawdown limit more useful in live trading. If you’re ready to put your trading plan into practice, create an account.
Drawdown as a percentage of initial capital
This percentage measures the decline against the original capital, rather than against a later account peak.
Calculating Percentage Drawdown
Calculate initial-capital drawdown by dividing the loss from the starting balance by that starting balance, then multiplying by 100. For example, a $3,000 loss from $10,000 initial capital equals 30%. This gives traders a consistent metric for an evaluation, even after profits or further losses change the account value. Keep the starting amount fixed, or the percentage comparison will shift.
Dollar and Percentage Drawdown
Dollar drawdown shows the amount lost, while percentage drawdown shows that loss relative to a reference value. A $5,000 decline from a $30,000 peak is 16.7%; the same dollar loss against a different peak produces another percentage. Track both figures: the cash amount helps show the immediate impact, while the percentage makes it easier to compare performance across account sizes.
Initial-capital drawdown and peak-based drawdown answer different questions. The first shows how much of the original deposit has been lost; the second measures the decline from the account’s highest point. For example, an account that peaks at $55,000 and falls to $52,000 has a peak-to-current drawdown of 5.45%. Its starting-capital percentage could differ, depending on the original balance.
Loss size also changes the profit needed to recover. A 10% account loss requires roughly an 11.1% gain from the reduced balance to return to the starting point. After a 20% loss, recovery requires a 25% gain; after a 25% drawdown, it takes 33.3%. The recovery percentage is larger because gains apply to the smaller remaining balance, not the original capital.
This asymmetry matters when judging a strategy’s backtest or live execution. A 50% loss on a $100,000 account leaves $50,000, which must double to regain $100,000. At a 100% loss, equity reaches zero, so no finite percentage gain on that balance can restore the previous capital. Set tolerance with both the potential decline and recovery hurdle in view.
For a useful evaluation, record the initial balance, each later account value, and the deepest decline. Keep drawdown from initial capital separate from maximum peak-to-trough drawdown. The distinction shows whether a strategy has eroded the original deposit, given back accumulated profit, or done both.
Maximum drawdown formula
Maximum drawdown measures the deepest decline from a running account peak to a later trough. Calculate it in dollars and as a percentage to see both the cash lost and the loss relative to available capital.
Maximum drawdown percentage = (running peak − later trough) ÷ running peak × 100. For the dollar measure, subtract the trough from that peak. The denominator is the peak, not the starting balance.
To find maximum drawdown across a trading history, follow each account value in sequence. Keep a running record of the highest value, compare each later value with that peak, and note the largest decline. When the account reaches a new high, update the running peak. A recovery to the previous peak ends that drawdown episode; if the account has reached a new high, measure any later decline from that level.
Trade order can change maximum drawdown without changing the ending result. The sequence matters because each decline is measured against the peak reached before it.
This example also shows why ending capital alone is an incomplete measure. Two strategies can produce the same final profit yet expose an account to different losing periods along the way. A larger interim decline can put more pressure on available funds and make it harder to stay within your chosen tolerance. Review the path of account values, not just the final balance.
Dollar and percentage maximum drawdowns can identify different episodes. Dollar declines grow with account size, while percentage declines compare each loss with its preceding peak. Record both measures before judging which episode tested capital more severely.
Use equity values when open positions are part of the risk being measured; closed-trade values omit temporary losses during those trades. Apply the same valuation method throughout the account history. For a clear comparison, record each period’s value, running peak, dollar decline, and percentage decline. The largest percentage decline is the maximum percentage drawdown; the largest dollar decline is the maximum dollar drawdown. They do not have to occur at the same time.
Account survival and drawdown tolerance
Calculate drawdown tolerance by setting the largest account loss you can absorb, then expressing it in dollars and as a percentage of starting capital. Compare that ceiling with the strategy’s historical maximum drawdown and the account’s operating limits. A micro account drawdown tolerance calculation is useful when it tests whether your planned position size can withstand realistic losses, not just pursue a profit target.
A backtest’s maximum drawdown is a historical result, not a ceiling for future losses. One practical stress test multiplies that maximum by 2; another sizes expected drawdown at 1.5× to 2× the backtested maximum. For a strategy with a 10% backtested maximum drawdown, the suggested live-trading allowance is 15-20%. If that allowance exceeds your tolerance, reduce exposure or reconsider whether the strategy fits.
Size also depends on the time spent below a peak. A 10% drawdown recovered in two weeks presents a different holding challenge from the same decline taking 18 months. Include the dollar loss, percentage decline, and recovery period in your tolerance assessment. A broker account’s available capital and a prop firm’s drawdown floor are different constraints, so assess each alongside your personal loss threshold.
Simulated outcomes can reveal how trade order affects survival, but model assumptions matter. One calculator example reports a 63.0% risk of ruin over 150-trade runs, despite a positive 0.50R-per-trade edge and a $2,000 trailing drawdown. Its result defines ruin as simulated runs that hit the drawdown before finishing. Treat that outcome as a model result, not a forecast: the calculator assumes independent trades and doesn’t model streaks, changing edges, fees, or slippage. Use a micro account drawdown tolerance calculation to frame the risk, not to predict a precise outcome.
Position size should leave room for losses beyond the backtest. Live drawdowns can exceed historical results, and a maximum observed during a backtest may be exceeded over another five years of trading. Futures traders can paper trade a strategy for 30-60 days before committing capital, then use observed drawdown to refine sizing. For futures margin, keeping capital at 2-3 times minimum margin is recommended to help manage drawdowns and avoid margin calls.
Set a personal loss ceiling first, then compare it with stressed strategy drawdown and account limits. If the stressed decline threatens that ceiling, reduce position size until the modeled loss fits. Revisit the calculation when your strategy or account conditions change. Put your account plan into action.
TradingPRO: Micro Account
TradingPRO offers a Micro Account for traders looking for an account option suited to micro-account trading. Use your drawdown calculation to assess whether its trading conditions fit your planned position size and loss tolerance before you begin.
Let your risk limits guide your account choice, rather than relying on the account label alone. TradingPRO also offers Rookie, Pro, and Scalp Accounts, giving you distinct options to consider alongside your trading approach. A Micro Account does not remove market risk, so keep your drawdown measure and trading plan central to every decision.
If you’re ready to take the next step, connect with TradingPRO about its Micro Account.
Make your next trading decision with discipline
Turn your drawdown limit into a decision rule before your next position. A micro account drawdown tolerance calculation is most useful when it guides position size, sets a point to pause, and informs reviews as market conditions or your strategy change. Include these decisions in your trading plan so pressure does not dictate them during a losing stretch.
Use your plan to assess whether an account option fits your approach and risk boundaries. TradingPRO offers Rookie, Micro, and Pro Accounts for traders considering their next step. Choose deliberately, with your tolerance and trading objectives in view.
Contact TradingPRO about your account and take your next step with a clear plan.
Frequently Asked Questions
How much do I need to make back after a loss?
The required gain depends on the percentage lost, because recovery applies to the smaller remaining balance. After a 30% loss, the account needs a 42.9% gain to return to its previous value. Don’t treat the loss percentage and recovery percentage as equal. Calculate the recovery target from current equity, then consider whether your position size and trading plan can pursue it without exceeding your risk tolerance.
How much gain does it take to recover from a drawdown?
A 40% drawdown requires a 66.7% gain from the trough to regain the prior peak. Calculate recovery as the loss amount divided by the remaining balance, then multiply by 100. This helps set realistic recovery expectations before changing trade size.
What happens if I breach the drawdown limit?
A breach means the account has crossed its defined loss threshold. The consequences depend on the account’s rules: a prop firm evaluation may fail, or trading access may be restricted under its terms. A daily limit and an overall drawdown limit can apply separately, so crossing one can matter even if the other remains intact. Know which equity measure and threshold apply before trading.
Balance or equity, relative or absolute?
Balance records closed trades, while equity reflects the account’s current value, including profit or loss on open positions. An absolute drawdown uses a fixed reference, such as the starting balance. A relative or trailing drawdown follows a peak, so a rising account can raise its loss floor. Identify the account’s reference point and valuation method before comparing a loss with its limit.
Does an open position count toward drawdown?
Yes. When drawdown is measured using equity, an open position’s floating loss affects the current value before the trade closes. If the account’s rules use closed-trade balance instead, that temporary loss may not appear in the same way. For risk planning, monitor unrealized losses alongside closed results, especially near a daily or trailing threshold. A market move can change equity before your next decision.
How do I calculate how much I can lose today?
Start with the account’s daily loss allowance, then subtract losses already recorded for the relevant period. Include open-position losses if the rule measures equity, and account for trading costs that reduce net value. The remainder is the loss budget available before reaching the limit. Divide that budget among planned trades, leaving room for positions that move against you at the same time.
What is the formula for percentage drawdown from account equity or balance?
Use (reference peak − current value) ÷ reference peak × 100. Apply the formula consistently to either balance or equity. A starting-balance percentage instead uses the original account value as its denominator, so label the metric clearly when recording results.
What is the difference between balance drawdown and equity drawdown?
Balance drawdown reflects closed trade results; equity drawdown also captures floating gains or losses on open positions. A $10,000 balance with a $500 open loss has $9,500 equity, so the account is already below its balance even before closing that trade. Track equity to see current exposure, and balance to review realized performance. The right measure depends on the risk being assessed.


