




- Published on: 2026-11-12 18:15:35
Managing Trade Fees on Micro Lot Positions: Pip Value and Costs
A micro lot reduces the cash value of each pip, but it doesn’t eliminate trading costs.
Smaller positions can help control exposure, so it’s tempting to assume their costs will be small too. But spreads and overnight charges can accumulate across several positions, and fees can take a larger share of a modest profit target. Measure total costs against the price movement needed to break even.
This guide explains how lot size affects pip value and break-even movement, how spreads affect short-term targets, and how account pricing can change your total trading cost. It also shows why several small positions can require more attention and cost differently from one larger trade, helping you assess fees before choosing a position size.
Key Takeaways
- A micro lot is typically 1,000 units, and its pip value depends on the currency pair and quote currency.
- Calculate how far price must move to offset spread and commission before judging a trade’s break-even point.
- Compare trading costs with your target movement; small fees can take a larger share of short-term gains.
- Assess account-tier pricing by looking at total costs, including spreads, commissions and any applicable holding charges.
- Track combined exposure and ongoing costs across small positions, since several trades can add up and take more effort to manage.
How Does Lot Size Affect Pip Value?
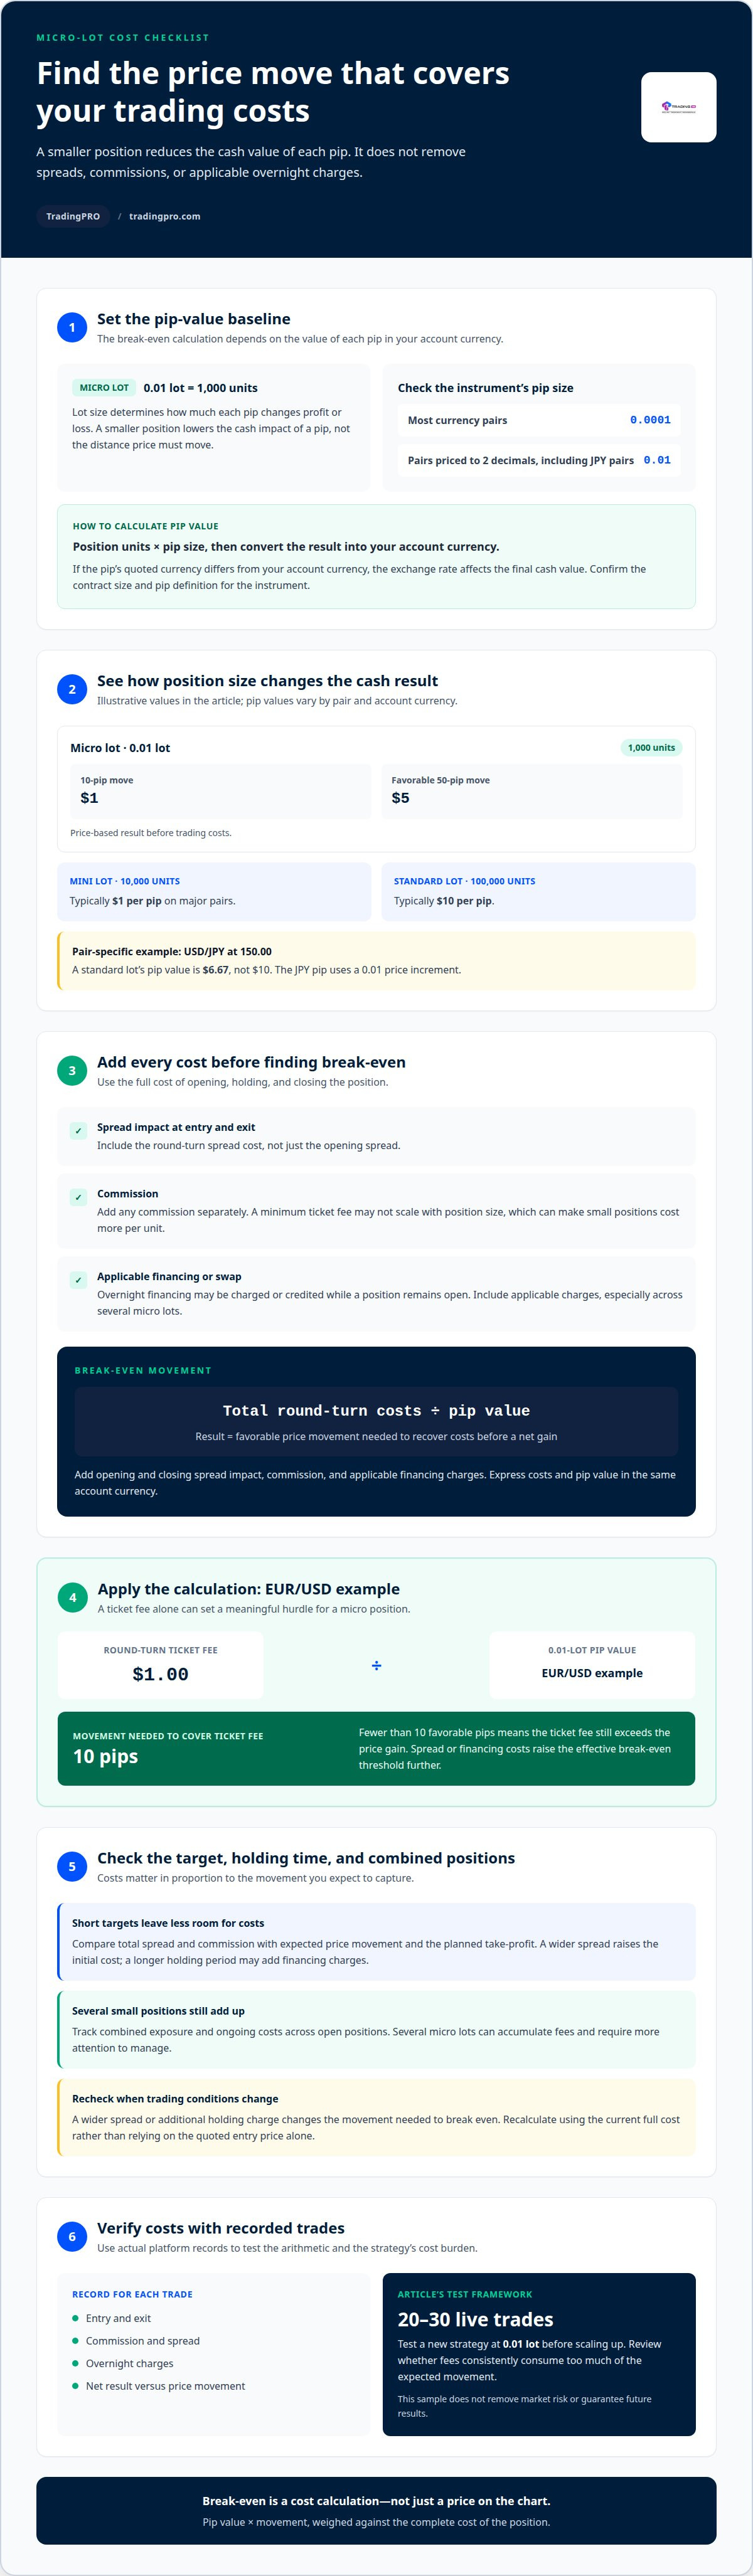
A micro lot is 0.01 lots, or 1,000 units of the base currency for a standard forex contract. Lot size sets how much each pip changes the position’s profit or loss. On most currency pairs, one pip equals 0.0001; for pairs priced to two decimal places, including JPY pairs, one pip equals 0.01. A smaller position reduces the cash impact of each pip, but it doesn’t change the distance price must move.
Multiply that value by the pip movement to estimate the price-based result: a 10-pip move equals $1, while a favorable 50-pip move equals $5, before trading costs. By comparison, a mini lot is 10,000 units and typically yields $1 per pip on major pairs. A standard lot is 100,000 units, with a typical $10 pip value.
Calculate pip value by multiplying position units by the pip size, then converting the result into your account currency. This conversion matters because the pip’s quoted value may be in a different currency from your account. If both currencies are USD, the calculation is direct. If they differ, the exchange rate affects the final cash value. When contract terms are unchanged, pip value scales in proportion to lot size.
Currency pairs don’t all produce the same dollar pip value. For USD/JPY at an exchange rate of 150.00, a standard lot’s pip value is $6.67, rather than $10. The JPY pip uses a 0.01 price increment, while most other currency pairs use 0.0001. Confirm the instrument’s contract size and pip definition before applying the calculation.
Base-currency units also shape notional value, the position’s underlying exposure. Its equivalent value in another currency moves with the exchange rate. Gold illustrates why the forex shortcut cannot be applied to every instrument: a 0.01-lot XAU/USD position represents one troy ounce, so a $1.00 gold-price move changes profit or loss by $1.00.
Overnight financing, often called a swap, may be charged or credited while a position remains open. Include any applicable swap in the position’s running costs, especially when holding several micro lots.
Break-even movement needed to cover trading fees
A trade breaks even on fees only after a favorable price move covers its round-turn costs. Add the opening and closing spread impact, any commission, and applicable financing charges, then divide the total by the position’s pip value. The result is the movement needed to recover those costs before the trade makes a net gain. The quoted entry price alone doesn’t show this threshold.
For example, on EUR/USD, a $1.00 round-turn ticket fee requires a 10-pip movement to break even on a 0.01-lot position. If the market moves fewer than 10 pips favorably, the ticket fee still exceeds the price gain. A spread or financing debit raises the effective threshold further.
Commission structures also affect the calculation. Divide the commission by the position’s pip value to find the movement needed to cover commission alone, then include the spread and other applicable charges. A minimum ticket fee may not scale with position size, leaving small positions with a higher cost per unit.
Lot size scales gains and losses as well as costs. A mini lot has ten times the volume of a micro lot, so the same pip movement produces a larger cash result and greater exposure to an adverse move. Calculate position size from your planned stop distance and acceptable loss, rather than using leverage to justify a larger trade. Leverage and pip value are separate factors to consider when assessing a position’s costs and risk.
Trading conditions affect how far price must move for a trade to break even. A wider spread raises the initial cost, and a longer holding period may add financing charges. As a result, a short profit target may leave little room for a net gain. Compare expected price movement with total costs before entry, and recalculate if conditions change. Express entry, exit, spread, commission, and holding charges in the same account currency.
Test the arithmetic with actual platform records. Record each entry, exit, commission, spread, and overnight charge, then compare net results with price movement. Test a new strategy for 20-30 live trades at 0.01 lot before scaling up. That sample helps reveal whether fees consistently consume too much of the strategy’s expected movement. It doesn’t remove market risk or guarantee future results.
For a clear practice framework, set up trading access and use small positions to observe how recorded costs affect your own calculations.
Risk planning also keeps fee calculations in perspective. A 15-pip move corresponds to potential losses of $15 on a mini lot and $150 on a standard lot in the example. Check the contract specification and pip value for each instrument before trading it. The formula for lot size is account balance multiplied by risk percentage, divided by stop-loss pips multiplied by pip value. Five consecutive losses at 5% risk per trade result in a 25% account loss in the example.
Margin is separate from pip cost: under MetaTrader's standard forex margin calculation method, required margin is calculated as volume in lots multiplied by contract size and divided by leverage. Gold routinely moves $20.00 to $35.00 during a London or New York trading session, so instrument-specific cost and risk checks matter.
Spread costs relative to short-term profit targets
The spread reduces a trade’s net result from the outset, so it matters more when the profit target is small. Compare spread and commission costs with expected movement, and include both in your risk management.
Managing Commissions and Spreads
To manage commissions and spreads, calculate the full entry-and-exit cost and compare it with the trade’s expected gain. Even a small charge can consume a substantial share of a micro-lot trade’s modest target.
That cost applies even if the platform shows a favorable price move after entry. Add any commission separately, then compare total costs with the planned take-profit movement.
Use the full round-turn cost, not just the opening spread, to assess whether a short target leaves room for net gains. If trading costs consume more than 15% of expected gain, they work against the trade’s edge. Include spread in stop-loss distance too: a 50-pip planned stop with a 1-pip spread has an effective distance of 51 pips. That difference changes risk relative to account balance.
U.S. Micro-Lot Trading Charges
In the United States, micro-lot trading costs combine the currency pair’s spread with any commission charged on the account. There is no single typical spread or commission amount: the total depends on the pair, account pricing, trade size, and execution conditions.
A commission quoted per side is charged when opening and again when closing a position. Distinguish per-side pricing from round-turn pricing before comparing costs, or you may miscalculate the total.
For a short-term trade, convert the spread into a cash cost using pip value, then add the commission for both sides. Compare the total with the gross profit expected at your target. Spreads can change with the currency pair and market conditions, while commissions depend on the account’s pricing method. Exchange-traded products may use a different fee structure, so don’t apply forex assumptions to them.
Set your stop loss and target with these costs in mind. If a small target leaves little net gain after spread and commission, revise the trade plan rather than treating gross profit as the likely result. A platform may reflect costs at different stages of a position, so evaluate the completed trade’s net result.
Spread markups and all-in costs across account tiers
Account pricing may include a spread markup, commission, or both. Compare the total cost per completed trade, not a single headline figure. A tighter quoted spread may come with commission, while a wider spread may include more of the broker’s charge. Compare how each pricing structure affects your planned position size, holding period, and expected profit.
Minimum ticket commissions can weigh heavily on micro lots in accounts with raw spreads. If the calculated commission is below the minimum, the effective cost per unit will be higher than a simple per-lot calculation suggests.
This distinction matters when trading with a small account. For a micro lot, calculate the total round-turn commission and spread, then compare them with the planned stop loss and target. If the quote currency differs from your account currency, convert pip value into your account currency to assess costs against potential profit. Leverage affects margin requirements, but it doesn’t reduce a trade’s spread or commission.
Before opening a micro-lot position in the United States, account for spread markups, minimum ticket commissions, and overnight swap charges. Establish whether commission is quoted per side or round turn, and whether currency conversion affects charges listed in another currency. Costs may appear in separate platform fields, so assess them together instead of relying on the displayed spread alone.
Standard-account commission schedules often quote a fee per standard lot. If the calculated fee falls below a minimum ticket charge, the minimum applies instead. Compare the stated rate and minimum charge at your intended trade size; otherwise, a standard-lot headline rate may not reflect the cost of trading micro lots.
Use the same assumptions to compare account tiers: currency pair, lot size, expected holding time, and opening and closing conditions. Add spread and commission, then include swap charges if the position remains open overnight. A wider spread can outweigh a lower commission, while a minimum charge can dominate a very small position. The total cost, not the account label, determines how far price must move to cover fees.
Traders should understand their broker’s commission structure, particularly its spreads, because costs can add up when managing many small positions. Risk sizing should account for stop-loss distance; wider stops require smaller lots to keep risk constant. An industry-standard range is risking 1-2% of an account on each trade. For a $5,000 account risking 2% on EUR/USD with a 50-pip stop, the calculated position size is 0.20 standard lots. With a $10,000 account, a $100 risk limit, and a 40-pip stop, the example position size is 0.25 standard lots. A 20-pip adverse move on a position worth $10 per pip represents approximately $200 before other trading costs.
Costs of maintaining multiple small positions
Every open trade adds its own spread, commission, and possible holding charge. Assess total exposure and cumulative costs together, not just trade by trade. To manage trade fees on micro lot positions, track the costs added by every open ticket.
You may reduce overall fees by avoiding unnecessary tickets and accounting for minimum charges. But position size and trading frequency don’t automatically make each trade cheaper; the result depends on how charges apply to each position.
Position Size and Fee Reduction
Position size determines the volume exposed to each pip movement and the amount of trading activity that generates charges. Separate tickets can create repeated costs, even when their combined volume matches one larger position.
For example, 100 positions of 0.01 lots each represent 100,000 units in total volume, equivalent to one standard lot under standard forex sizing. Separate positions may still incur separate commissions or minimum ticket charges. Their spreads also apply across individual entries and exits. Equal combined volume therefore doesn’t guarantee equal total costs.
Set position size based on the planned pip stop loss and the capital you’re prepared to risk. Then consider whether you can express the same trade idea with fewer positions without changing its intended risk. Don’t increase position size just to avoid a minimum charge: a larger lot also magnifies gains and losses per pip. Aim for appropriate exposure and avoid unnecessary fee-generating tickets.
Trade Frequency and Fee Reduction
Trade frequency refers to how often you open and close positions. Reducing unnecessary round trips can limit repeated transaction costs, which matters when short-term targets leave little room between gross profit and accumulated fees.
Review your trading log by strategy or currency pair. Count completed trades, then compare their combined costs with the strategy’s net result. Frequent entries can generate repeated spreads and commissions, while longer holding periods may add overnight financing. Fewer trades or longer holds don’t automatically improve results; the setup, exit plan, and charges determine the outcome.
Before opening another position, make sure it has a distinct rationale and fits your overall exposure. When managing trade fees on micro lot positions, track the full trade cycle, including entries, exits, and applicable holding charges. Many small positions can take more time and effort to manage than one standard lot. Review total open volume and shared market exposure together so repeated entries don’t obscure the capital at risk.
Use a trading account to apply your position-sizing plan and track how multiple small trades affect total costs.
TradingPRO: Micro Account
TradingPRO’s Micro Account is an option to consider if you use micro-lot sizing and track the costs of each position. Apply the calculations above to assess how spreads, commissions, and holding charges affect your trading approach.
Before choosing an account tier, compare your planned position sizes and trading frequency with the applicable pricing structure. TradingPRO also offers Rookie, Pro, and Scalp Accounts, designed for different trading approaches.
For a closer look at whether TradingPRO’s Micro Account suits your needs, contact TradingPRO.
Make fee review part of your trading routine
Make cost awareness a repeatable part of your decision process. Before a trading session, decide how you’ll assess each strategy’s execution costs and whether its expected movement justifies another position. Afterward, compare the recorded outcome with your plan. This routine can show when it’s time to reassess trade frequency, holding time, or account pricing.
Managing trade fees on micro lot positions requires more than a one-time calculation. Market conditions and your approach can change, so review costs in line with how you trade. Focus on the decisions you can control: planned exposure, entry frequency, and how you evaluate net results. A clear process makes fee information useful, rather than just another number on a platform.
If you’re ready to discuss how trading costs fit your approach, discuss trading costs with TradingPRO. Keep refining your plan with care and confidence.
Frequently Asked Questions
How do fees affect break-even points and profitability on micro-lot trades?
Fees push the break-even point beyond the opening price, so price must move far enough in your favor to cover them. To assess profitability, compare the completed trade’s net result in your account currency with its gross price movement. For example, record spread, commission, and any holding charge separately in your trade journal. This makes it easier to identify which costs affected the outcome and assess whether the same setup remains worthwhile.


