




- Published on: 2026-10-27 10:16:54
How to Use Multi-Timeframe Analysis to Align Trends, Entries and Levels

One chart sets the bias; another sharpens the setup; a faster chart helps refine the entry. A practical multi-timeframe analysis guide pairs timeframes far enough apart to reveal distinct perspectives, with a 4:1 ratio as a useful minimum, and applies indicators such as moving averages or RSI to support, not replace, price structure. The right pairing depends on whether you’re swing trading, day trading or scalping.
It’s easy to add charts and indicators in pursuit of certainty. But more signals can mean more noise, especially when short-term price swings conflict with the broader trend. The goal is alignment, not a screen full of confirmations.
Learn how to choose a timeframe stack, read indicators in context, and map support and resistance from the broader chart down to a potential entry. This guide also covers the method’s benefits and risks, including how to avoid treating every timeframe equally or changing your approach after just a few trades.
Key Takeaways
- Match your chart stack to your trading horizon: use broader charts for direction and smaller ones to examine potential setups and entries.
- Read indicators in the context of each chart. A moving average or RSI signal can differ across timeframes because each reflects a different stretch of price action.
- Keep your analysis focused: avoid treating every timeframe as equally important, and give a consistent chart combination 30 to 50 trades before changing it.
- Mark major support and resistance on broader charts first, then use lower timeframes to assess how price behaves near those levels.
- Weigh clearer context against added complexity. Multiple timeframes can help organize a trading plan, but they can also create conflicting signals and false confidence.
What Are the Best Technical Analysis Indicators to Use Over Multiple Timeframes?
Choose indicators that clarify trend, momentum, and potential entries, rather than adding signals for their own sake. Start with a timeframe stack suited to your trading style, then check whether the indicators support a consistent market picture.
-
Match Timeframe Combinations to Trading Styles
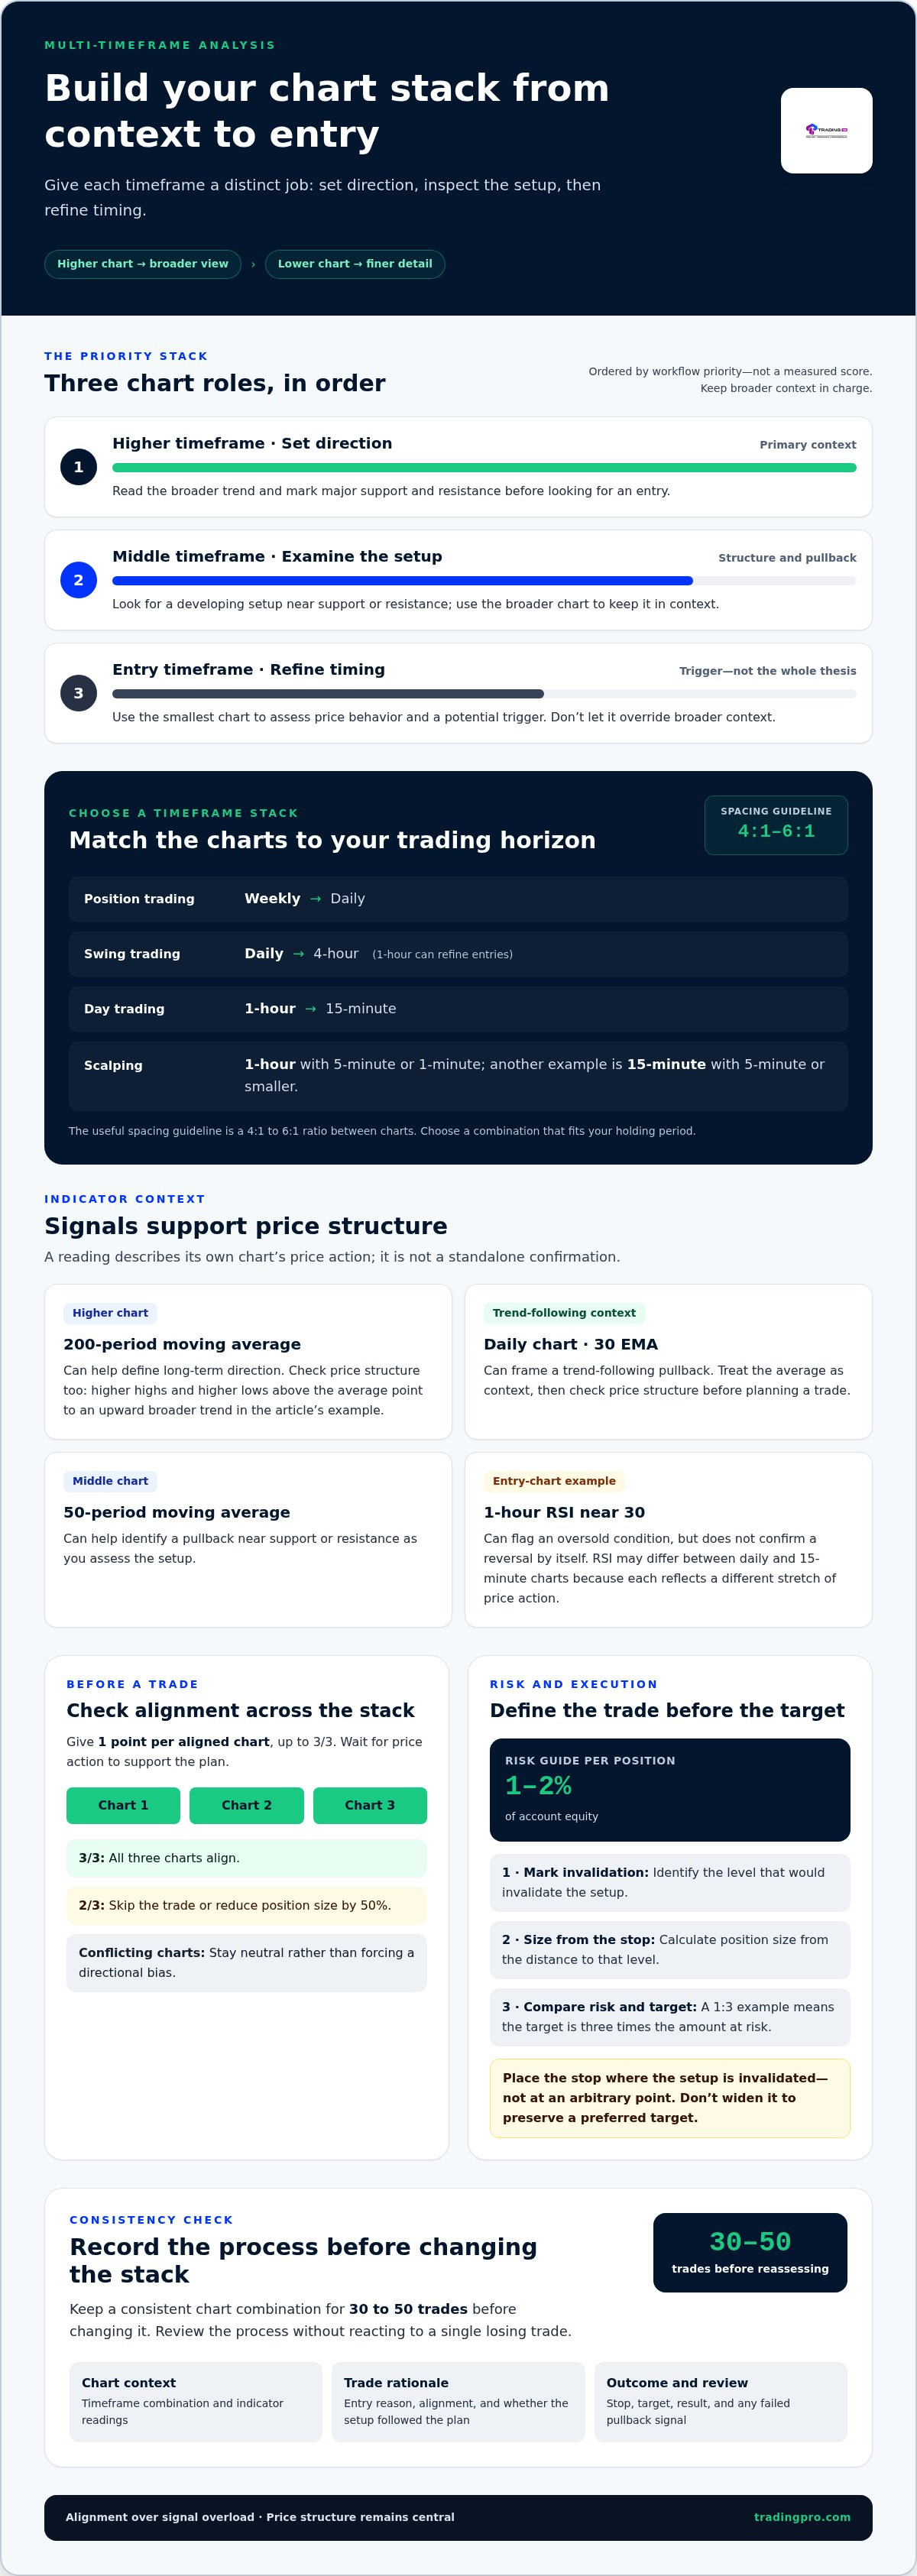
Choose charts that fit your holding period, then keep enough distance between them to reveal different market views. A useful spacing guideline is a 4:1 to 6:1 ratio between charts. For swing trading, compare daily and 4-hour charts; for position trading, use weekly and daily charts. Day traders can pair 1-hour and 15-minute charts. Scalpers may use a 1-hour chart with a 5-minute or 1-minute chart.
-
Apply Timeframes to Different Trading Styles
Use the higher chart to set direction and the lower chart to inspect a setup. Day traders, who usually open and close positions on the same day, can read a 1-hour chart for intraday direction and a 15-minute chart for a potential entry. Swing traders, who often hold positions for several days or weeks, can use daily and 4-hour charts. Position traders can prioritize weekly and daily charts over short intraday views.
- Set a trend indicator on the higher timeframe. Use a 200-period moving average to help define long-term direction. For example, if price holds above that average and the chart forms higher highs and higher lows, the broader trend points upward. A daily chart with a 30 EMA can also frame a trend-following pullback. Treat the indicator as context, then check price structure before planning a trade.
- Use the middle and lower charts to confirm the setup. A 50-period moving average on the middle timeframe can help identify a pullback near support or resistance. On the 1-hour chart, an RSI reading near 30 can flag an oversold condition, but it doesn't confirm a reversal by itself. RSI readings can differ between daily and 15-minute charts because each measures price changes over its own timeframe.
- Record results before changing your chart stack. In a trading journal, note the timeframe combination, indicator readings, entry reason, and outcome for every position. Review whether weekly or daily direction aligned with the entry chart, and record when a pullback signal failed. Keep a chosen combination for 30 to 50 trades before changing it. That sample helps you assess your process without reacting to a single losing trade.
Time-frame examples for swing, day, and position traders
Common strategies pair a higher chart for market context with a lower chart for entries. For example, swing traders can compare daily and 4-hour charts, while day traders can use 1-hour and 15-minute charts.
-
Compare Timeframes for Trading Styles
Choose frames that match how long you expect to hold each position. Swing traders can use daily, 4-hour, and 1-hour charts to track direction, examine setups, and refine entries. Day traders can use 1-hour and 15-minute charts, while position traders can prioritize weekly and daily charts. For scalping, compare a 15-minute view with a 5-minute or smaller chart, and avoid letting the entry chart override broader context.
- Score alignment, then wait for a clear setup. Check whether the higher, middle, and entry timeframes support the same direction. Record one point for each aligned chart, up to 3/3. If the score is 2/3, skip the trade or reduce position size by 50%. If the charts conflict, stay neutral rather than forcing a directional bias. A strong process includes waiting for price action to support the plan.
- Set risk before deciding on a target. A risk guide for multi-timeframe trades is 1-2% of account equity per position. First mark the level that would invalidate the setup, then calculate position size from the distance to that stop. Compare the potential target with the risk: a 1:3 risk-reward example means the target is three times the amount at risk. Don't widen a stop simply to preserve a preferred target.
-
Improve Trade Entries and Exits
Use the middle chart to locate structure, then let the entry chart provide a trigger. For a daily, 4-hour, and 1-hour stack, the daily chart sets direction, the 4-hour chart tracks the developing setup, and the 1-hour chart helps refine timing. Place a stop where the setup is invalidated, not at an arbitrary point. Set an exit around a visible structure target, then follow the plan.
- Review execution in a trading journal. Log the timeframe stack, alignment score, entry trigger, stop, target, and outcome for each trade. Separate setup quality from execution: note whether the charts aligned, whether the entry followed the plan, and whether the exit respected the target. Review a consistent sample before changing rules. Once your process is written down, you can create a trading account to apply it.
Common multi-timeframe analysis mistakes
Use a consistent chart sequence and a clear decision rule before placing a trade. A 4:1 spacing guideline helps separate timeframe roles, but it won’t remove conflicting signals.
-
Recognize Conflicts Between Timeframes
Compare the direction on each chart before taking action. For example, a daily chart may show higher highs and higher lows while a 15-minute chart pulls back. That lower-timeframe move doesn’t automatically reverse the broader trend. Treat it as a possible pullback, then wait for the entry chart to show a setup that fits your plan. If the charts disagree, don’t cherry-pick the one signal that supports your preferred position.
- Separate a pullback from a change in direction. Check whether price has broken meaningful structure on the higher chart, not just whether a minute chart has turned lower. A quick dip on a 5-minute chart can occur within a broader upward move. Reassess the higher timeframe’s swing points and support or resistance before deciding that the trend has changed. This prevents a short-lived fluctuation from dictating your entire strategy.
-
Avoid Common Timeframe-Selection Mistakes
Choose chart frames for distinct jobs, and avoid stacking timeframes that show nearly identical price action. A 15-minute and 10-minute pairing may add little context, while a 1-minute chart can amplify short-term fluctuations. Use the broader chart to establish direction and the lower timeframe to assess a potential entry. Keep the spacing guideline of at least 4:1 in view, then test whether each chart adds a useful decision point.
- Don’t treat every chart as equally important. Decide in advance which timeframe sets direction, which tracks the setup, and which helps with entry timing. If a weekly chart informs your position but a minute chart flashes a contrary signal, don’t let the fastest chart take control. Define what counts as a meaningful conflict for your strategy, such as a break of a marked swing point, rather than reacting to every candle.
- Use an alignment rule instead of forcing trades. Score each of three timeframes as aligned or not aligned with your intended direction. The target is 3/3 alignment; a 2/3 score calls for skipping the trade or reducing position size by 50%. This rule limits selective interpretation when one chart supports the trade and another contradicts it. Record the score and reasoning before entry, not after seeing the outcome.
- Keep your strategy stable long enough to evaluate it. Changing chart frames after each losing trade makes it difficult to tell whether the method or execution needs work. Log the chosen timeframes, signal, and result, then review the same combination across 30 to 50 trades before changing it. Look for repeated issues, such as entries against higher-timeframe direction or exits triggered by minor lower-timeframe noise. Adjust one part of the process at a time.
Support and resistance across timeframes
Start with the higher chart and mark meaningful support and resistance. Then move down to inspect price action near those levels. The sequence is straightforward: establish direction, map zones, compare charts, and use lower-timeframe signals to plan an entry.
-
Map Support and Resistance Across Timeframes
Mark zones where price repeatedly stalled or reversed on the higher chart, rather than drawing levels around every candle. On a daily chart, a prior EUR/USD support level at 1.0850 can frame the area to watch. Then check how the 4-hour chart behaves as price approaches it. A brief move through the zone differs from a clear rejection followed by renewed buying.
-
Conduct Top-Down Analysis Across Three Timeframes
Use three charts in sequence: the daily chart for broad direction, the 4-hour chart for developing structure, and the 1-hour chart for potential timing. First identify whether daily price action shows an uptrend, downtrend, or range. Next, locate the nearest support and resistance on the 4-hour chart. Finally, watch the 1-hour chart for a setup near those mapped areas, not in the middle of nowhere.
-
Align Higher and Lower Timeframes in a Trading Plan
Write down the higher-timeframe bias, the level that matters, and the lower-timeframe trigger before acting. For example, if the daily chart trends upward and price approaches support, wait for the 1-hour chart to show buyers defending that zone. A lower chart can refine timing, but it shouldn’t overturn the plan without a meaningful break in higher-timeframe structure.
- Read candlestick signals at the marked level. A bullish rejection candle near daily support can strengthen a long setup, while a bearish rejection near resistance can support a short-term reversal idea. Check where the candle forms and how it closes. A similar candle in the middle of a range has less context than one at a level visible across the daily and 4-hour charts.
- Compare chart patterns across scales. A range or breakout on a 1-hour chart may sit inside a larger daily downtrend. Note whether the pattern approaches higher-timeframe resistance before treating an upside break as a sustained change in direction. If a breakout candle closes above the zone, observe whether later candles hold that area or fall back below it. Use the pattern to frame a decision, not predict an outcome.
- Turn the chart read into a sequence of decisions. On your platform, select the higher chart and mark support and resistance, then move to the middle and entry charts. Record the trend, relevant level, candle signal, and the point that would invalidate the setup. If price reaches resistance while the broader chart remains in a downtrend, give that context more weight than an isolated bullish signal on the fastest chart.
Benefits and risks of multi-timeframe analysis
Three chart frames can connect a broad market view with entry-level detail. The method can sharpen decisions, but conflicting signals and added complexity can also weaken a trading plan. A practical multi-timeframe analysis guide treats each chart as a distinct input, not another vote for taking a trade.
- Use the higher timeframe to add context. A weekly chart can show whether price is broadly rising, falling, or moving sideways. This perspective helps distinguish a short pullback from a larger change in direction. For example, a brief decline on an hourly chart may matter less when the weekly structure remains upward. Use the higher timeframe to frame decisions, not dictate every trade.
- Keep indicators in supporting roles. Moving averages and RSI can help describe trend or momentum across charts, but they measure price differently on each timeframe. An RSI reading near 30 on an hourly chart doesn’t mean the daily chart is oversold. Compare each indicator with price structure and relevant levels. If the indicator conflicts with the chart pattern, pause rather than treating either signal as decisive.
- Account for the cost of extra detail. A lower timeframe can expose a potential entry, but it also shows more short-term fluctuations. A 5-minute chart may turn against a position while the 1-hour trend remains intact. Reacting to every candle can trigger premature exits or unnecessary trades. Define which chart controls entry and which informs the broader position before placing an order.
- Limit analysis to charts with distinct jobs. Three timeframes can provide trend, setup, and entry perspectives. Adding more charts may create competing signals without improving the decision. For example, two nearby frames may show nearly identical movement, repeating information instead of adding useful context. Keep the method focused, and record what each chart contributes to the trade plan.
- Test the process, not just its best examples. Log the timeframe stack, indicators, levels, entry reason, and exit for each trade. Review losing and winning trades together. If a pattern appears only in hindsight, it may not support a repeatable decision. Keep the same combination for 30 to 50 trades before changing it, then adjust one rule at a time so the effect is visible. Use this multi-timeframe analysis guide as a framework for reviewing decisions, not as a promise of results.
- Set risk before acting on alignment. Several charts pointing in one direction can strengthen a setup’s context, but alignment doesn’t remove market risk. Decide where the trade idea is invalidated, set a stop, and size the position around that distance. Many traders cap risk at 1-2% per trade. Build your approach around defined rules, then open a trading account to put your plan into practice.
TradingPRO: Rookie Account
TradingPRO’s Rookie Account is one option as you put a chart-based trading plan into practice. Multi-timeframe analysis helps structure market decisions, but it doesn’t remove the need to define your risk, entry conditions, and exit rules before trading. Choose an account that suits your approach and trading needs. TradingPRO also offers Micro, Pro, and Scalp Accounts.
If you’re ready to explore the account option, visit the Rookie Account page or contact TradingPRO.
Turn Your Trading Plan Into Consistent Action
Use this multi-timeframe analysis guide as a starting point, then shape your routine around decisions you can explain and repeat. A chart setup is more useful when your reasons for entering, managing, and closing a position are clear before you act. Refine your process through deliberate review, not rapid changes prompted by a single result.
TradingPRO offers Rookie, Micro, and Pro Accounts to support different trading approaches. Choose the next step that fits your goals and preferred style, while keeping risk management central to every decision.
Take the next step with TradingPRO and build your trading routine with focus and confidence.
Frequently Asked Questions
Which timeframes to use?
Choose charts that reflect your holding period, with enough separation to show different market perspectives. A day trader might review 4-hour, 1-hour, and 15-minute charts; a swing trader could use daily, 4-hour, and 1-hour charts. For position trading, weekly, daily, and 4-hour charts offer broader context. Assign each chart a clear job, and remove one if it doesn’t change your analysis or decisions.
What Are the Benefits Involved in Trading Over Multiple Timeframes?
Multiple charts can help distinguish a short-lived move from a broader market pattern. For example, a lower chart may show a brief countertrend bounce while a higher chart remains range-bound. Comparing them can help you avoid treating every price move as a new trend. The trade-off is added complexity: conflicting signals may delay decisions, and focusing too closely on short-term fluctuations can distract you from the original plan.
What Is Top-Down Analysis in Trading?
Top-down analysis starts with a broader chart, then moves to shorter charts to assess a possible trade. First, describe the higher chart’s condition as rising, falling, or sideways. Next, inspect the intermediate chart for a setup near a meaningful area. Finally, use the execution chart to assess timing. If the intermediate chart offers no clear setup, wait instead of searching the shortest chart for a reason to enter.
Which Time Frame Should You Trade?
Trade from the chart that matches the decisions your strategy requires. If you can’t monitor price closely, a fast chart may prompt more decisions than your routine can support. If you actively manage intraday positions, a shorter execution chart can help you assess an entry. Before choosing, consider your intended holding period, how often you can review charts, and whether you can follow the plan without reacting to every candle.
Which timeframes should beginners use for multi-timeframe analysis?
Beginners can start with a simple, consistent chart sequence, such as a daily chart for context and a 4-hour chart for setup review. Use the same markets and chart roles while learning to identify trends, ranges, and potential turning areas. Write down what would support or invalidate an entry before placing a trade. Avoid adding indicators or extra charts until you can explain what each one contributes.
How do traders identify trends and support and resistance across timeframes?
Read price structure first. On a higher chart, compare recent swing highs and lows: a sequence of rising highs and lows suggests upward movement, while falling swings point downward. Mark areas where price previously stalled or reversed, then inspect shorter charts as price approaches. Treat support and resistance as zones rather than exact lines, since candles can move through an area before showing whether price accepts or rejects it.
How can multi-timeframe analysis help with entry, stop-loss, and take-profit levels?
Use the higher chart to find relevant structure, then examine the lower chart for an entry trigger near that area. Place a stop where the trade idea would no longer make sense, such as beyond the swing that supports the setup. Set a take-profit target near a meaningful opposing level or structure. Before entering, check that the potential distance to the target justifies the risk.
How does multi-timeframe analysis differ for day trading, swing trading, and investing?
Day traders focus on intraday movement and typically open and close trades on the same day, so their analysis centers on session direction and nearer-term setups. Swing traders usually hold positions for several days or weeks, giving daily structure more weight. Investors generally make decisions over a longer horizon, so short-term candles may be less relevant. Match chart detail to the decision, not simply to the fastest available frame.


