




- Published on: 2026-10-25 10:16:36
How to Identify a Trending Market by Its Price Direction

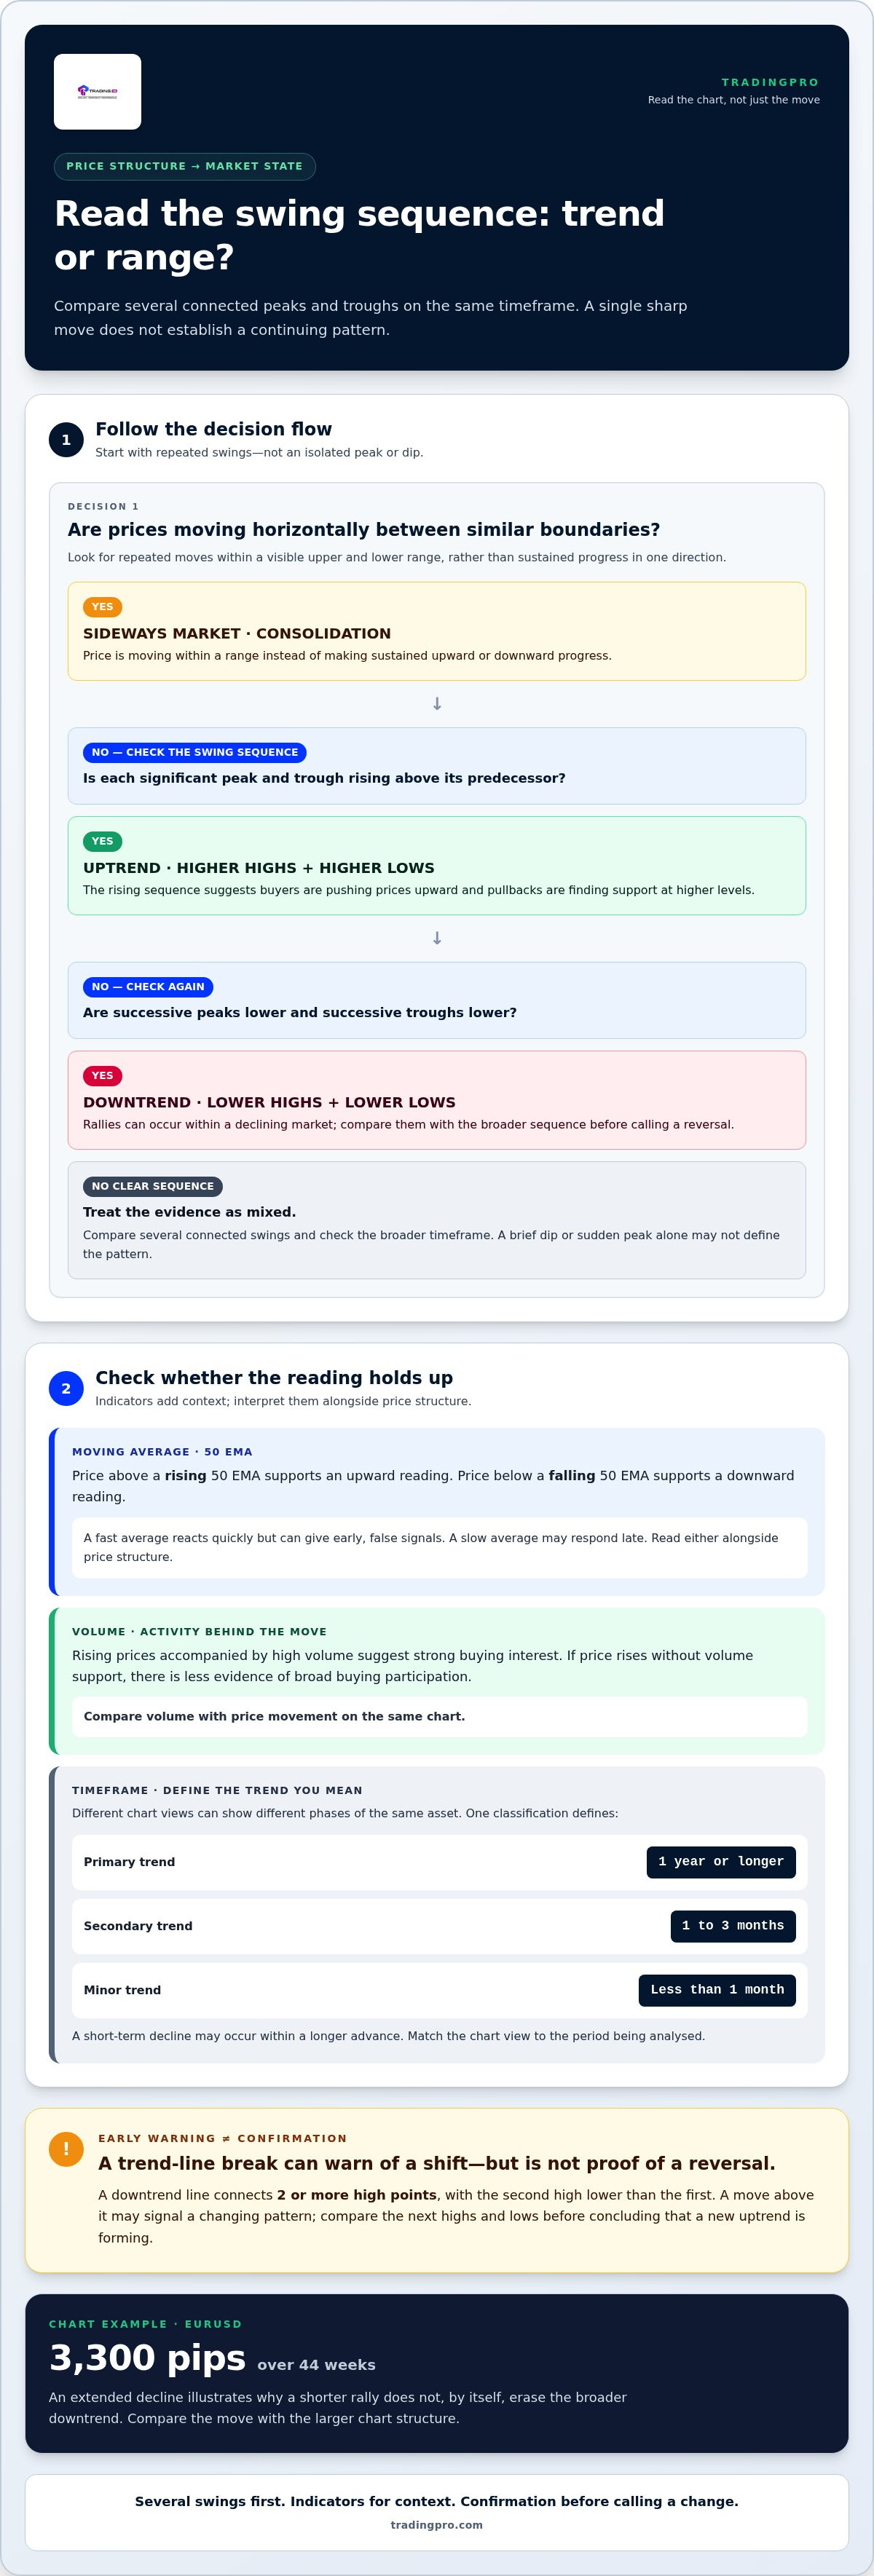
Price structure is the clearest starting point for learning how to identify a trending market: an uptrend forms higher highs and higher lows, while a downtrend forms lower highs and lower lows. When price moves horizontally within a range, the market is sideways rather than clearly trending.
These patterns give you a practical read on direction, but direction alone doesn’t show whether a trend is strong or nearing a turn. A trend-line break can warn that momentum is shifting, but treat it as a signal to assess alongside other price action, not proof of a reversal.
This guide explains how to distinguish uptrends, downtrends, and sideways markets, then assess trend strength using price structure and technical indicators. You’ll also learn what can make a trend look weaker, which reversal clues deserve attention, and why confirmation matters before interpreting a change in direction. Read the market more precisely and separate a meaningful shift from ordinary movement within an established trend.
Key Takeaways
- Read the sequence of price peaks and troughs to distinguish directional movement from consolidation.
- Use the ADX directional lines to compare buying and selling pressure, then interpret them alongside price action.
- Consider how economic releases and geopolitical developments can shift market expectations and influence price direction.
- Treat a trend-line break as an early warning, and look for additional signs before concluding that a reversal is underway.
- Explore TradingPRO’s Rookie Account as a trading account option when you’re ready to apply these market-reading concepts.
What is a market trend?
A market trend is sustained price movement in a discernible direction, revealed by comparing successive highs and lows. To identify one, start with those turning points, then use the chart timeframe and indicators for context. A single sharp move may attract attention, but it doesn’t establish a continuing pattern.
Higher Highs and Higher Lows
Higher highs and higher lows form when each significant peak and trough rises above its predecessor. This sequence suggests buyers are pushing prices upward and pullbacks are finding support at higher levels. For example, price climbs to a peak, retreats to a higher trough, then advances beyond its previous peak. This structure gives you a clear reference beyond isolated price changes.
Compare several connected swings rather than relying on one new high. A brief dip below a previous trough may interrupt the sequence, while a later recovery can restore it. To assess how to identify a trending market, check whether the pattern continues across the timeframe relevant to your analysis. Different chart views can show distinct phases of the same asset.
Price Highs and Lows
A price high is a peak before price turns lower; a price low is a trough before it rises. Comparing each with its predecessor reveals whether the market is making progress or revisiting similar areas. This helps distinguish a directional move from isolated volatility. A sudden peak, for instance, matters less if later swings fail to continue upward.
Mark turning points on the same timeframe before comparing them. A daily chart can show a different sequence from a shorter-term chart because each covers a different span of price action. Zoom out and switch to a line graph at least once a week for a broader view with fewer candle details. This perspective helps reveal whether recent movement fits the larger pattern.
Moving averages help confirm direction by smoothing price fluctuations. A 50 EMA can help assess mid-term direction: price above a rising average supports an upward reading, while price below a falling average supports a downward reading. A fast average reacts quickly but can produce early, false signals. A slow average may respond late, so interpret either alongside price structure.
Trading volume can add evidence to your trend reading by showing the activity behind a price move. Rising prices accompanied by high volume suggest strong buying interest. Compare volume with price movement on the same chart rather than reading a volume bar alone. If price rises without volume support, the chart offers less evidence of broad buying participation.
Timeframe shapes the trend being assessed. One classification defines a primary trend as lasting 1 year or longer, a secondary trend as lasting 1 to 3 months, and a minor trend as lasting less than 1 month. A short-term decline may occur within a longer advance. Match your chart view to the period you want to analyse.
To identify a trending market in practice, compare successive peaks and troughs first, then review a moving average and volume. When these signals agree, they strengthen the same directional interpretation. When they conflict, treat the chart as mixed evidence and assess the broader timeframe before deciding what the price structure suggests.
Uptrends, downtrends, and sideways trends
Distinguish a trend from a range by checking whether price swings progress in one direction or stay within horizontal boundaries. An uptrend advances, a downtrend declines, and a sideways market consolidates inside a range.
Distinguishing Trends from Ranges
A sideways market, also called consolidation, occurs when prices move horizontally within a range instead of making sustained progress upward or downward. This distinction matters because a rising price inside a range may approach resistance without establishing an uptrend. Compare several price swings: directional sequences show progress, while repeated moves between similar boundaries suggest a range.
Market phases can alternate. A rising primary trend tends to produce larger rallies and smaller retracements in its secondary trend, while a sideways phase can interrupt that advance. Intermediate trends may last several months, so assess the broader chart before treating a short move as a change in the market’s main direction.
For a practical comparison, mark the range’s visible upper and lower boundaries, then observe how price behaves near each. Repeated reversals inside those boundaries support a range reading. A sustained move beyond a boundary may indicate a shift, but assess the price structure that follows instead of treating one break as a complete new trend.
Downtrend Lines as Resistance
A downtrend line connects 2 or more high points, with the second high lower than the first. Extended across the chart, it can act as resistance: price may rise toward the line, then turn lower as sellers re-enter. The line helps frame rallies within a declining market, rather than treating every upward move as a reversal.
For example, if successive rallies stop near a descending line, that resistance supports a downtrend reading. A move above the line can warn that the pattern is changing, but it doesn’t establish a new uptrend by itself. Compare the next highs and lows to see whether price forms a stronger upward structure.
Chart examples show why timeframe matters. A EURUSD example recorded a 3,300-pip drop over 44 weeks, illustrating how a decline can develop across an extended period. A shorter rally within such a move wouldn’t, on its own, erase the broader downtrend; compare the rally with the larger chart structure.
Use trend lines as visual guides, not fixed barriers. If price repeatedly reacts near a descending line, note those interactions alongside the market’s swing highs and lows. If you’re ready to put your market-reading approach into practice, you can continue with a trading account.
Using ADX and directional indicator lines to assess trend direction and strength
ADX and its directional indicator lines add a momentum-based perspective to price structure. Read them alongside trend lines and chart patterns to judge direction, strength, and possible changes.
Reading ADX and Directional Indicators
The Average Directional Index, or ADX, helps assess trend strength, while the +DI and -DI lines indicate direction. An uptrend is signaled when +DI sits above -DI; a downtrend is signaled when -DI sits above +DI. When ADX rises, trend strength is increasing; when it falls, the move may be losing force.
During a range, the +DI and -DI lines tend to stay close together and hover around the middle. For example, if the lines repeatedly cross while price moves horizontally, directional pressure is less decisive. Use ADX with the price chart: the indicator helps describe strength, while price action supplies the market context.
Drawing Trend Lines and Channels
A trend line connects 2 or more price points and extends forward as a possible support or resistance guide. At least 2 touch-points are needed to draw one, with 3 being preferable. For an uptrend line, connect rising lows; for a downtrend line, connect falling highs. A parallel line can frame a channel around price swings.
In a rising market, an uptrend line can act as support as price pulls back toward it. A break below that line may warn of a developing change. A downtrend line can act as resistance, so a move above it may flag a possible shift in direction. Treat either break as a signal to reassess, not confirmation by itself.
Using Breakouts and Chart Patterns
Channels and chart patterns help organize price action around visible boundaries. If price breaks beyond a channel, compare the move with recent highs and lows and the ADX directional lines. Agreement between price structure and indicator direction adds evidence; conflicting readings call for a more cautious interpretation.
Chart patterns can help identify a potential breakout or trend transition, but they don’t guarantee that price will move as predicted. ADX and directional indicators also respond to past price movements, so signals may arrive late or give false readings in choppy conditions. Confirm a trend by checking whether price structure, indicator direction, and a trend-line or channel break point the same way.
For example, a break below a rising trend line combined with -DI moving above +DI gives more evidence of weakening upward direction than either signal alone. Check whether subsequent price swings support that reading. This combination won’t remove uncertainty, but it provides a clearer basis for interpreting a possible transition.
Macroeconomic and geopolitical influences
Price direction reflects more than chart patterns. Inflation, employment data, central bank decisions, elections, and geopolitical events can change expectations, shifting demand across currencies, commodities, and other markets. Technical analysis shows how prices respond; macroeconomic context helps explain why a move might gain or lose momentum. Compare an event with the asset’s price action rather than assuming headlines determine direction.
Central bank policy is an important influence. For example, a Federal Reserve decision can affect expectations for the US dollar as traders reassess interest rates and economic conditions. Stronger-than-expected inflation data can reshape those expectations, while weaker data can shift them in another direction. The market response depends on how a release compares with what participants already anticipated, not simply whether a figure rose or fell.
Economic releases can also affect assets by changing growth expectations. Employment reports, consumer spending, and business activity offer clues about economic momentum. If data strengthens the outlook for a country, its currency or related assets may attract buying interest. If releases point to weaker activity, selling pressure can emerge. Track the release, the immediate price response, and whether follow-through appears on the chart.
Geopolitical developments can alter the outlook for supply, trade, and risk. A conflict affecting an important energy-producing region, for example, can shift expectations for oil supply and move energy prices. Trade restrictions can influence companies and currencies exposed to affected markets. Separate the event’s direct economic impact from broader sentiment, then assess whether price movement persists beyond the initial headline reaction.
Add a simple context check to your technical analysis. First, identify the asset and the economic factors most closely connected to it. Next, note relevant releases or developments, such as a central bank announcement for a currency pair. Then compare the market’s reaction with its existing price structure. A breakout that aligns with a lasting change in expectations has different context from a brief spike that quickly fades.
Consider a hypothetical currency pair that has been rising before a central bank announcement. If the decision changes expectations, price could reverse, pause, or extend its existing move. The announcement alone doesn’t establish a new trend. Watch how price behaves afterward: whether it holds beyond a prior boundary, returns to its earlier range, or continues in the prevailing direction. That response connects the event to observable market behaviour.
Economic and geopolitical factors can affect several markets at once. A disruption to energy supply can influence oil prices, inflation expectations, and currencies tied to energy trade. Compare related assets to see whether their responses support the same explanation. Use that context to interpret price direction, not replace chart analysis: the market’s highs, lows, and follow-through show whether a broader shift is taking hold.
Identifying trend reversals
A reversal is a change from an established price direction to movement in the opposite direction. The distinction matters because a pullback can resemble a turning point before the broader trend changes. Read a suspected reversal as a developing sequence: look for a break in the existing structure, then assess whether later price action supports the new direction.
Start with the trend line and the swing points it connects. A break below an uptrend line may indicate that a change is developing, especially during a strong established trend. But one breach is a warning, not a complete reversal signal. Check whether price continues lower and whether subsequent highs and lows begin forming a pattern opposite to the earlier trend.
Then compare indicators with price behaviour. A MACD crossover above its signal line suggests a bullish trend, while a crossover below suggests a bearish trend. RSI ranges from zero to 100; readings above 70 indicate an overbought condition, while readings below 30 suggest oversold conditions. These readings describe momentum or market conditions, but they don’t independently establish that direction has reversed.
For example, an overbought RSI reading during an advance can draw attention to stretched momentum. If price still holds its rising structure, that reading alone doesn’t establish a downturn. Look for additional evidence, such as a break below an uptrend line followed by continued weakness. Combining price structure with an indicator helps distinguish a possible transition from a temporary pause.
Historical chart examples show why follow-through matters. One EURUSD example describes a 3,300-pip drop after a breakdown. An AUDUSD example describes a loss of 680 over the next 30 trading days after a breakdown. These cases illustrate how a broken structure can precede a substantial move, but they are examples, not a forecast for another market.
Use a practical confirmation sequence: identify the established direction, mark the level or trend line that would challenge it, then observe price after a break. Check whether momentum indicators support the developing direction and whether later swings continue the shift. If price quickly recovers the broken line or returns to its prior structure, the reversal case is weaker than when multiple signals align.
Chart patterns can help frame a potential transition, but they don’t guarantee that a market will move in the predicted direction. Treat a broken trend line as an alert to reassess, not an automatic entry instruction. This keeps the focus on evidence that develops after the initial break, when price action can clarify whether the market is transitioning or simply correcting.
Apply these reversal checks to your own chart analysis, then put your market-reading approach into practice.
TradingPRO: Rookie Account
TradingPRO’s Rookie Account is a natural next step when you’re ready to apply trend analysis through trading. Use the concepts in this guide to frame your market view: identify direction, distinguish a range from a trend, and assess whether reversal signals align before making decisions.
TradingPRO also offers Micro, Pro, and Scalp Accounts, giving traders options suited to different trading approaches. Choose the account that fits how you plan to engage with the markets, and ground your analysis in price action rather than relying on a single indicator. Trend identification supports decision-making; it doesn’t remove market risk or guarantee an outcome.
Explore the Rookie Account or visit tradingpro.com to learn more about TradingPRO.
Turn Market Insight Into Your Next Move
Build a repeatable process for reading price direction, then use it to shape your decisions as market conditions change. Knowing how to identify a trending market is useful, but the next step is applying that analysis with discipline. Define what evidence would support your view, what would challenge it, and how much uncertainty you’re prepared to manage.
TradingPRO offers the Rookie Account, Micro Account, and Pro Account for traders with different approaches. Consider which account aligns with your goals as you move from chart analysis to active trading. Keep your plan grounded in your own objectives, and avoid treating any market signal as a guaranteed outcome.
Ready to take a considered next step? Explore your TradingPRO account options and continue building your market skills with confidence.
Frequently Asked Questions
How do you identify trends?
Start by choosing a chart timeframe that matches your trading horizon, then inspect how price behaves around recent turning points. Add a moving average or directional indicator as a second perspective, not a replacement for the chart. For example, if price rises while an average slopes upward, the signals support the same direction. If they conflict, examine a broader chart before drawing a conclusion.
What are the three types of trends?
Markets move through three broad directional conditions: uptrends, downtrends, and sideways trends. An uptrend advances, a downtrend declines, and a sideways market fluctuates within a range. These labels describe price behaviour, not an asset class or a fixed duration. A currency pair, commodity, or other traded market can shift between these conditions as buying and selling pressure changes.
What is a trending market in trading?
A trending market shows sustained directional progress rather than repeatedly returning to a similar range. Traders use that direction to frame decisions, compare current price action with the broader chart, and assess whether a move aligns with their strategy. For example, a market that keeps advancing beyond prior trading areas behaves differently from one oscillating between established boundaries.
How can you identify an uptrend or downtrend using price action?
Compare successive swing points and examine how price reacts after advancing or declining. An uptrend is supported when pullbacks attract buyers and the market continues upward; a downtrend is supported when rallies lose strength and selling resumes. Check the sequence across your chosen timeframe. A short-lived counter-move can occur inside a broader trend, so avoid judging direction from one candle.
How do traders use higher highs and higher lows to identify an uptrend?
Traders mark each clear swing high and swing low, then compare them with preceding swings. If both sets of turning points keep moving upward, the structure supports an uptrend reading. For example, a pullback that holds above the previous trough shows buyers defending a higher area. The next advance provides fresh evidence about whether upward progress is continuing.
Which indicators measure trend strength, such as ADX?
The Average Directional Index, or ADX, measures trend strength, while its +DI and -DI lines help indicate direction. The relative strength index and MACD offer other momentum perspectives, but they answer different questions. Compare indicators with the asset’s price action. For instance, a rising ADX alongside a clear directional move supports a stronger trend reading than an indicator signal viewed alone.
What time frames are best for identifying market trends?
The best timeframe depends on whether you’re assessing a long-term, intermediate, or short-term move. In one classification, a primary or long-term trend lasts 1 year or longer, a secondary or intermediate trend lasts 1 to 3 months, and a minor or short-term trend lasts less than 1 month. Compare a broader chart with your chosen timeframe to distinguish larger market direction from shorter fluctuations.
How can support and resistance levels help identify trend changes?
Support and resistance mark areas where price has previously met buying or selling pressure. Watch how price behaves when it revisits those areas: a clear break followed by continued movement beyond the level can signal a shift in market behaviour. A quick return inside the prior range suggests something different. Combine the level with swing structure and trend indicators to assess whether direction is changing.


