




- Published on: 2026-10-22 10:18:07
Higher Highs and Lower Lows: Reading Price Trend Structure

Price structure can reveal a trend before an indicator does. In higher highs and lower lows trading, a sequence of higher highs and higher lows points to an uptrend, while lower highs and lower lows point to a downtrend. Equal lows form when price tests a similar trough area more than once. Lower highs are peaks below the previous peak and can signal bearish pressure or a possible reversal.
These swings offer a practical way to read market direction, but one peak or trough isn’t enough to confirm a trend. The sequence matters, as does the timeframe: a pattern on a short-term chart may not reflect the broader market.
This guide explains how to identify swing highs and lows, distinguish bullish from bearish structure, and recognize when a range makes trend signals less useful. You’ll also learn how traders use pullbacks and breakouts to plan entries, place stop-losses around key structure, and set profit targets with risk in mind. The goal is a clearer framework for reading price action, not a promise that every pattern will predict the next move.
Key Takeaways
- Read swing highs and lows as a sequence; one isolated turning point doesn’t establish the market’s direction.
- Use the chart timeframe that fits your trading style, and treat sideways price action differently from a clear trend.
- In a downtrend, watch how each rebound compares with the previous peak to assess whether bearish structure is holding.
- Anchor risk decisions to nearby price structure, including recent swing points, rather than relying on trend direction alone.
- Look for successive higher peaks and troughs to recognize bullish structure and assess potential pullback areas.
What are equal lows and lower highs?
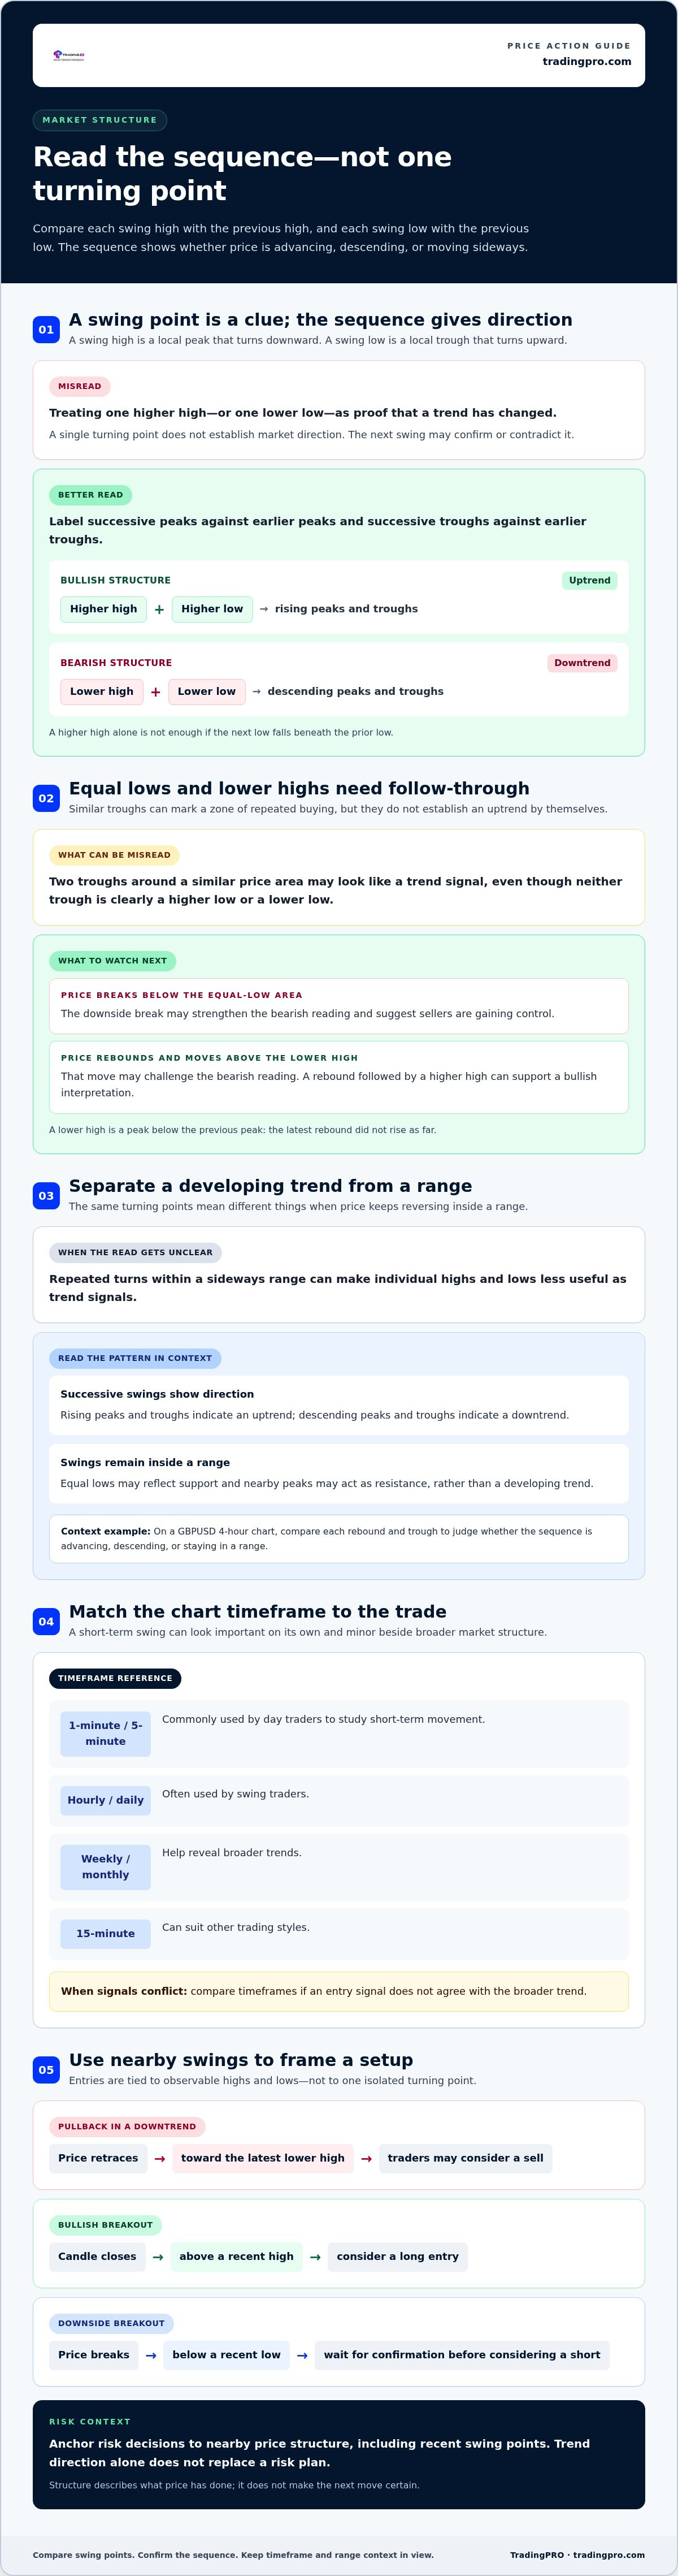
Equal lows form when price reaches a similar trough area on separate swings. They can mark a support zone where buying has repeatedly appeared, but they don’t establish an uptrend by themselves. A lower high is a peak below the previous peak. It shows that buyers couldn’t push price as high during the latest rebound, which can signal weakening upward momentum or continued bearish pressure.
Read these points as a sequence. For example, if price makes a high, retreats to an equal low, then fails to reach its previous peak, the structure differs from a clear series of rising highs and rising lows. The next swing adds information: a break below the equal-low area may strengthen the bearish reading, while a move above the lower high may challenge it. Market structure helps traders assess sentiment through price action rather than interpreting one turning point in isolation.
There’s no universal candle count or fixed number of timeframes that confirms a new high or low. Identify the swing on your chosen chart, then assess whether later price action supports the same direction, such as a close above a recent high for a breakout.
Choose a timeframe that matches the intended trade. Day traders commonly use 1-minute or 5-minute charts to study short-term movement; swing traders often use hourly or daily charts. Weekly or monthly charts help reveal broader trends, while a 15-minute chart can suit other trading styles. A 1-minute swing may look important on its own, yet appear minor beside the weekly structure. Compare timeframes when the entry signal conflicts with the broader trend.
For a pullback trade, use the latest swing as a reference: in a downtrend, traders may sell when price retraces toward the most recent lower high. For a bullish breakout, wait for a candle to close above a recent high before considering a long entry. For a downside breakout, look for a break below a recent low, then wait for confirmation before considering a short. These setups tie entry decisions to observable highs and lows.
Sideways action needs a different read. If price repeatedly turns within a range, equal lows may reflect support and nearby peaks resistance, rather than a developing trend. Trend analysis is more useful when successive swings show direction. A GBPUSD example on the 4-hour timeframe can help illustrate that distinction: compare each rebound and trough, then judge whether the sequence is advancing, descending, or staying inside a range. This structure helps frame possible trend changes and trading decisions.
Definitions of higher highs, lower lows, higher lows, and lower highs
A swing high is a local peak where price stops rising and turns downward. A swing low is a local trough where falling price turns upward. Compare each new turning point with the previous one of the same type. This straightforward technical analysis gives traders a clearer view of market direction than a single candle can provide.
Use these definitions to label the sequence:
- Higher high: a peak above the previous swing high, showing buyers pushed price further upward.
- Higher low: a trough above the previous swing low, suggesting buyers entered before price fell as far.
- Lower high: a peak below the previous swing high, showing a weaker rebound.
- Lower low: a trough below the previous swing low, showing sellers drove price lower.
For example, imagine a chart rising to a peak, pulling back, then climbing to a higher peak. If its next trough also stays above the earlier trough, both types of swing are rising. That paired sequence indicates an uptrend. The reverse sequence, with each peak and trough below its predecessor, indicates a downtrend. One higher high alone doesn’t establish bullish structure if the next low falls beneath the prior low.
Equal points need careful interpretation. If two troughs form around a similar price area, neither is clearly a higher low or a lower low. Treat them as equal lows, then watch how price reacts around that zone. A decisive move below it may show sellers gaining control; a rebound followed by a higher high may instead support a bullish reading. The sequence after the test helps guide decisions.
These definitions apply across stocks, forex, crypto, and futures. The structure uses the same comparison of successive peaks and troughs, but trading hours, liquidity, and volatility can shape how quickly price moves between them. For instance, a gap in a stock chart may create a sharp jump between swings, while a fast move in a currency pair may produce a brief peak. Read the asset’s own price action rather than assuming every market forms identical-looking swings.
Use the points to describe what price has done, not to predict certainty. A lower high can precede a bearish reversal or simply mark a pause before price rises again. Check whether the next swing confirms or contradicts the developing pattern, then align the technical reading with your planned investment decisions. Put these chart-reading concepts into practice by observing how each new swing compares with the last.
Identifying downtrends from descending peaks and troughs
A sequence of lower peaks and lower troughs indicates a downtrend; rising peaks and troughs indicate an uptrend. Moving averages smooth price, while trendlines connect swing points. Both add context without replacing price-structure analysis.
Recognizing Direction from Swing Points
A downtrend develops as successive rebounds peak lower and declines reach lower troughs. Each weaker rebound shows buyers making less upward progress, while each fresh low signals continued selling pressure. An uptrend reverses that sequence: peaks rise, and pullbacks stop above earlier troughs. Direction comes from the relationship between swings, not from one dramatic candle.
Assess the latest completed swing against the previous swing of the same type. If a rebound fails below the last peak, then price falls beneath its prior trough, bearish structure gains support. If price instead rises above the lower peak, the downtrend may be weakening. Look for the next swing to clarify whether pressure is changing or the original direction remains intact.
Finding Swing Highs and Lows on Charts
A swing high is a local crest between rising and falling price action; a swing low is a local trough between falling and rising action. On a candlestick chart, mark the areas where movement changes direction, then compare those points across the visible sequence. The goal isn’t to label every candle. It’s to identify clear pivots that shape the chart’s pattern.
Use the timeframe that fits the trade: 1-minute or 5-minute charts show short-term movement, while hourly or daily charts support medium-term analysis. Weekly or monthly charts help reveal broader trends. A small pullback can look like a reversal on a short chart but remain a pause on a longer one. Keep the timeframe consistent while comparing swing points.
Using Indicators and Trendlines
Indicators offer another view of price action. A moving average smooths fluctuations, helping traders see whether price generally sits above or below its recent path. RSI or MACD can complement swing analysis by providing momentum context. These tools may support a reading, but they don’t change what the chart’s peaks and troughs show.
A trendline connects successive swing lows in an uptrend or swing highs in a downtrend. A break can flag a change worth examining, but the next swing helps show whether structure has actually shifted. Combine the line or indicator with price action: a downtrend remains intact while lower peaks and troughs continue, even if an indicator briefly turns upward. This is technical analysis, not individualized investment advice.
Managing risk and setting profit targets
Use recent swing points to define when a trade idea no longer holds, then set a target before entering. A stop-loss and planned exit turn price structure into a risk framework.
Placing Stops and Managing Risk
A stop-loss marks the price level where you exit if the structure contradicts your trade. In an uptrend, place it below the most recent higher low, where a break can challenge the rising sequence. In a downtrend pullback trade, the recent lower high helps frame the setup and its invalidation point.
For a range trade, place the stop just beyond the range. A move outside that boundary can signal a breakout, so a stop within the range risks triggering before the structure is clearly broken. Match position size to the distance between entry and stop: a wider stop means less exposure for the same planned account risk.
Before entry, identify the previous swing, the recent swing, and the level that would invalidate your reading. If price breaks below an uptrend’s latest higher low, reassess the long setup rather than widening the stop to preserve it. This keeps decisions tied to observable action and limits emotional changes during fast market moves.
Setting Profit Targets
A profit target is a planned exit level chosen from price structure and the trade’s risk. For an uptrend entry near a higher low, a recent high can provide a reference, while a breakout above that high may leave room for another target. In a downtrend, traders can use previous lows as potential areas to take profit.
One described risk-management approach targets a 1:1.5 risk-to-reward ratio. In practice, the intended reward distance is one and a half times the distance from entry to stop. Compare that target with nearby swing levels before acting; a strong resistance area may sit before a calculated target in a long trade, while support may interrupt a short.
Plan the exit alongside the stop, not after price moves in your favor. For example, if selling pressure drives price toward a previous low, decide whether that level is the target or whether a confirmed break supports holding for a further move. Traders may also take profit during an uptrend before a possible downtrend. Use the structure to define the decision, then follow the plan.
Bullish structure using higher highs and higher lows
Traders identify an uptrend by comparing successive swing points: each peak rises above the previous peak, and each trough stays above the previous trough. This pairing shows upward progress through both advances and pullbacks, giving bullish structure more weight than a rising peak alone.
Picture a GBPUSD chart on the 4-hour timeframe. Price climbs to a new peak, pulls back, then finds buyers above its previous trough. If price advances beyond the prior peak, the sequence contains both a higher low and a higher high. Traders can use that structure to assess whether buying pressure remains active and whether a pullback may offer an entry area.
A higher low matters because it shows sellers couldn’t push price back to the previous trough before buyers returned. A higher high then shows buyers carried price beyond the last peak. Together, these points indicate an uptrend. By contrast, a new peak without a higher low may leave the structure unclear, while a break below the latest higher low challenges the bullish reading.
Traders applying higher highs and lower lows trading principles can use the most recent higher low as a reference for a pullback strategy. The setup looks for price to retrace toward that trough, then show renewed upward action before entry. A potential stop-loss can sit below the latest higher low, where a break would undermine the structure. This approach ties the trade to a clear price level rather than buying simply because the market has risen.
Fibonacci retracement can help map possible pullback areas: draw its levels from the most recent higher low to the most recent higher high. One described setup waits for a retracement to the 61.8% level and places a limit order there. Treat that level as a reference within the structure, not as proof that price will reverse. Candlestick patterns, strong candle formations, or high volume can add breakout context.
Structure also helps traders recognize when an uptrend may be losing momentum. If price fails to form a new higher high, upward momentum may be weakening, and a reversal becomes possible. A lower high or a move beneath the latest higher low adds evidence of changing conditions. Read the sequence as it develops; don’t treat one signal as confirmation of a bearish trend.
Make bullish structure part of a defined strategy: mark the latest high and low, plan the pullback or breakout condition, and decide where the setup fails. A higher highs and lower lows trading strategy works best when each decision follows a clear plan for entries and risk. Put your price-structure strategy into practice with a clear plan for entries and risk.
TradingPRO: Rookie Account
TradingPRO’s Rookie Account is a natural next step for readers ready to apply price-structure analysis to their trading. Use the concepts in this guide to build a clear process: identify the trend, define the swing level that would challenge your view, and plan your entry and exit before acting.
Choose the Rookie Account as a starting point for putting chart-reading decisions into practice. Traders with different approaches can also explore TradingPRO’s Micro, Pro, and Scalp Accounts to find an option suited to their trading style. Keep risk management central as you apply any strategy; recognizing a pattern doesn’t remove market risk.
Explore the Rookie Account or visit tradingpro.com to learn more.
Put Your Market-Reading Process Into Practice
Make your next step deliberate. Before entering a trade, write down what would support your market view, what would invalidate it, and how you’ll respond if price behaves differently. This turns higher highs and lower lows trading into a repeatable decision process rather than a reaction to every chart movement.
TradingPRO offers the Rookie Account, Micro Account, and Pro Account for traders considering an account suited to their approach. Focus on learning how your decisions hold up across changing market conditions, and keep risk limits central to your plan. A clear framework can help you act with purpose while staying alert to new price information.
Ready to take the next step? Explore your trading options with TradingPRO and continue building a disciplined approach to the markets.
Frequently Asked Questions
How to spot higher highs and higher lows?
Compare successive confirmed turning points on the same chart and timeframe. Mark a peak, then compare the next peak; repeat with each trough. For example, if the next peak rises but the next trough falls below its predecessor, the sequence isn’t consistently bullish. Keep your markings consistent, including whether you use candle extremes or closing prices, so your comparisons don’t shift midway through analysis.
What does a higher high and lower low mean?
A higher high and a lower low show price expanding in both directions rather than forming a clear sequence of rising or falling swings. For example, a market might rally above its previous peak, then sell below its earlier trough. That combination signals changing or unsettled structure, not a confirmed trend by itself. Watch how later swings develop before assigning a directional bias.
How Do You Identify Trends with Market Structure?
Track the order and placement of price swings, then check whether advances and pullbacks support the same direction. Useful analysis starts with a consistent chart timeframe and clear turning points. Next, compare each new peak with the last peak and each trough with the last trough. If the comparisons conflict, treat direction as unclear rather than forcing a bullish or bearish label.
What do higher highs and higher lows mean in trading?
They describe bullish market structure: buyers are pushing price to new peaks while preventing pullbacks from reaching earlier troughs. Traders can use this pattern to frame a buying plan, such as waiting for a retracement before considering an entry. If a later trough breaks beneath the previous one, reassess the bullish setup. Structure informs a decision; it doesn’t determine the trade outcome.
What do lower highs and lower lows mean in trading?
They describe bearish structure: each rebound reaches a lower peak, and each decline reaches a lower trough. This pattern suggests sellers are maintaining pressure across successive swings. A trader considering a short setup can assess whether a rebound stalls below the previous peak, rather than entering solely because price has fallen. A move above that peak challenges the bearish reading and calls for reassessment.
How can traders identify swing highs and swing lows accurately?
Use one chart timeframe and one consistent method for marking turning points. A swing high stands out where an advance gives way to a decline; a swing low appears where a decline turns upward. Don’t mark every brief pause as a major pivot. Compare the selected points with surrounding price action, then keep the same candle-price convention throughout your chart review.
How do traders use lower highs and lower lows to identify a downtrend?
They check whether each rebound peaks below the previous rebound and each decline breaks beneath the previous trough. The sequence helps distinguish sustained downward structure from an isolated sell-off. For a pullback setup, traders can watch for price to retrace toward the most recent lower high, then assess whether selling resumes. A break above that swing high signals that the existing pattern needs reassessment.
Where should stop-loss and take-profit levels go when trading market structure?
For an uptrend trade, a stop-loss can sit below the most recent higher low; for a range trade, place it just beyond the range. Set a take-profit level against the next relevant swing or planned risk-to-reward relationship. One described approach targets 1:1.5 risk-to-reward. Check whether nearby support or resistance lies before the target, and define both exit levels before entering.


