




- Published on: 2026-10-20 10:34:47
Elliott Wave Theory and How Fibonacci Shapes Price Moves

Elliott Wave theory for beginners starts with a clear pattern: markets often move in five waves in the direction of a trend, followed by a three-wave correction. The five-wave impulse contains three motive sub-waves and two corrective ones. Elliott Wave analysis uses this structure to interpret price action, while Fibonacci ratios help estimate possible retracements and extensions.
This framework can make a chart feel more orderly, but it does not promise where price will go. Wave counts can be interpreted differently, and patterns may change as new price data appears. Treat them as a way to build and test a market scenario, not as a stand-alone signal.
Learn how wave structure works, where Fibonacci levels fit, and what the theory’s limitations mean for practical trading decisions. This guide also covers Elliott Wave’s history and core rules, helping you assess potential setups with a clearer view of opportunity and risk.
Key Takeaways
- Distinguish zigzags, flats, and triangles by how their internal waves form, then use that structure to read a correction in context.
- Use Fibonacci retracements and extensions to map potential price zones, not as guaranteed turning points.
- Apply impulse-wave rules to assess whether a proposed count fits the price action or needs reconsideration.
- Compare wave counts across timeframes and pair them with risk planning to avoid treating one interpretation as a standalone signal.
- Explore TradingPRO’s Rookie Account if you’re looking for an account option as you develop your approach to trading.
What Is Elliott Wave Theory?
Elliott Wave Theory reads market action as repeating wave patterns: a trend move followed by a correction. This structure helps traders describe possible price scenarios, but a wave count is an interpretation, not a way to predict price with certainty.
Motive and Corrective Wave Structure
A motive wave moves with the larger trend, while a corrective wave moves against it. This distinction helps traders judge whether price action may be continuing a trend or pausing within it.
An impulse has five sub-waves: three motive waves and two corrective waves. In the internal 5-3-5-3-5 structure, waves 1, 3, and 5 advance with the trend, while waves 2 and 4 pull back. In a bullish market, for example, the motive sequence generally rises, with corrections interrupting its advance.
Corrections typically involve three sub-waves against the trend. They may form an A-B-C pattern or develop into more complex structures. Identifying the pattern gives traders a framework for describing the chart, rather than treating every pullback as a new trend reversal.
Zigzags, Flats, Triangles, and ABC Corrections
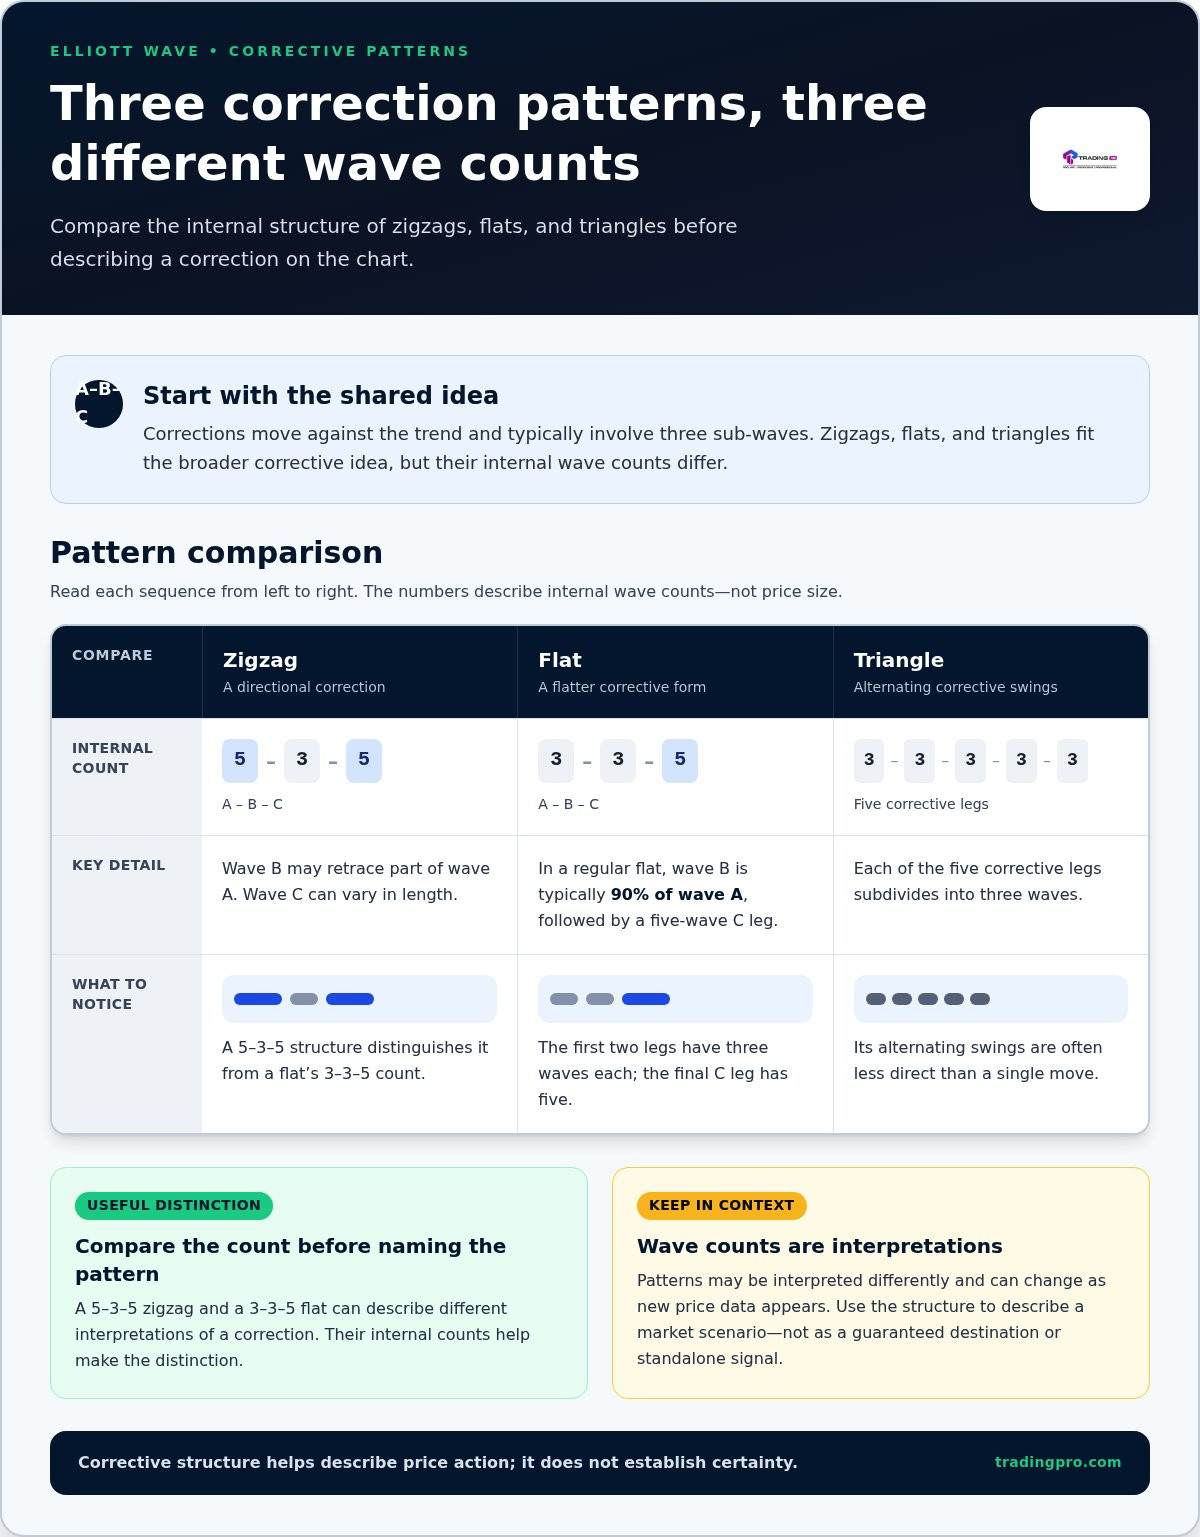
Zigzags, flats, and triangles are corrective patterns with distinct internal structures. Recognizing their wave counts helps traders describe a correction more precisely and compare possible interpretations of the same chart.
A zigzag commonly follows a 5-3-5 A-B-C structure: wave A has five sub-waves, B has three, and C has five. In a zigzag, wave B may retrace part of wave A, while wave C can vary in length. These relationships help outline possible proportions, not fixed destinations.
A flat commonly follows a 3-3-5 structure. In a regular flat, wave B is typically 90% of wave A, followed by a five-wave C leg. A triangle has five corrective legs, each subdividing into three waves. Its complete internal pattern is 3-3-3-3-3, often showing alternating swings rather than a direct move.
These patterns all fit the broader A-B-C idea, but their internal counts differ. For instance, an analyst looking at a correction can compare a 5-3-5 zigzag with a 3-3-5 flat before labeling the price action. That distinction can change how the trader interprets the correction’s shape and its place in the larger trend.
Wave Degrees and Time Frames
Wave degrees describe a pattern’s relative scale, from smaller waves nested inside larger ones to broader market movements. They matter because the same price action can appear corrective on one chart and impulsive on another.
A smaller-degree sequence can form part of a larger-degree wave. For example, a five-wave move on a short-term chart may sit within one segment of a broader pattern. Degree refers to a wave’s place in this hierarchy, not to a fixed duration.
Time frames provide different views of that hierarchy. A one-year chart can show a corrective wave while a 30-day chart shows a developing impulse. Neither view automatically cancels the other: the shorter chart may display detail inside a larger correction. Compare the chart’s wave structure with the higher-degree context before treating a bullish or bearish count as the dominant reading.
For beginners studying Elliott Wave theory, the practical takeaway is to label both the pattern and its degree. A wave count is more useful when smaller swings fit the larger structure and you can explain what evidence would challenge your interpretation.
Fibonacci retracements and extensions
Fibonacci analysis adds proportional reference points to Elliott Wave structure. Retracements map potential pullback zones, while extensions project possible wave targets.
Fibonacci Retracement Relationships
A Fibonacci retracement measures how much of an earlier price move a later swing gives back. In wave analysis, these ratios help compare pullbacks and assess whether a proposed count has plausible proportions.
Wave 2 often retraces 50% or 61.8% of wave 1, and some guidelines place it near 76.4%. The 50% level is a common technical reference, not a Fibonacci ratio. Treat each level as a zone to compare with price action, rather than an automatic entry signal.
For a worked calculation, take a 10-unit decline from 110 to 100. A 61.8% retracement of that move reaches 103.82. The calculation starts at the low and adds 61.8% of the decline’s size. This gives the trader a clear price reference; the chart’s structure and momentum still shape the interpretation.
Other wave relationships add context. Wave 4 commonly retraces 0.236 or 0.382 of the preceding wave, while corrective waves may retrace 38% of an impulse. These ratios help compare one pullback with another. They don’t determine the pattern alone, because price can turn before a level or move beyond it.
Fibonacci Extensions and Wave Projections
Fibonacci extensions project a potential target by multiplying an earlier wave’s length by a ratio. In Elliott Wave analysis, this helps compare expected wave proportions and frame possible price zones.
Wave 3 is often approximately 1.618 times the length of wave 1. To see the arithmetic, project 1.618 times a 10-unit wave 1 from a wave-2 endpoint of 104. The resulting target is 120.18. This is a projection based on the chosen wave count, not a forecast that price must reach that level.
Ratios such as 0.618, 1, 1.618, and 2.618 can describe relationships between Elliott waves. A value of 1 compares equal lengths; 1.618 projects a longer wave. Compare the projection with the chart’s broader structure and watch whether price action supports the count. If the momentum changes, reassess the scenario instead of forcing the original target.
Use retracements to assess where a pullback could fit, then extensions to map potential continuation targets. Keep the two calculations tied to clearly identified swing points, since changing the start or endpoint changes the result. A written plan can record the ratio, the relevant wave, and the price level together. If you’re ready to put a trading plan into practice, open a trading account.
Impulsive waves and five-wave trends
An impulse is a five-sub-wave move in the direction of the larger trend, with specific rules for testing a proposed count. Common mistakes include forcing labels onto price action and ignoring invalidation rules. Keep an alternate count when another structure also fits.
Impulse-Wave Structure and Rules
An impulse follows an internal 5-3-5-3-5 structure, and its rules help traders distinguish a valid count from a weak one. Wave 3 cannot be the shortest of waves 1, 3, and 5. Wave 4 does not overlap the price territory of wave 1. If either rule fails, reconsider the count rather than relabeling the chart to preserve it.
Wave 3 is at least equal in length to wave 1, except in a triangle. In a bullish example, waves 1, 3, and 5 each advance, while waves 2 and 4 interrupt that direction. Record the start and end of each swing, then compare the proposed sequence with the rules. A count that fits only after moving key turning points deserves an alternate interpretation.
Invalidation is the price action that makes a particular count untenable. For example, if a proposed impulse places wave 4 inside wave 1’s price territory, that count breaks the non-overlap rule. Traders can retain another plausible count, but should label it separately and identify what price movement would invalidate it.
Extensions and Diagonals
An extension is an unusually lengthened impulse wave, while a diagonal is a distinct pattern that can appear in an impulse position. Recognizing these structures matters because a longer-than-expected segment may change how traders interpret the remaining move and its potential endpoint.
Wave 3 often extends to 161.8% of wave 1, and it may reach 200%, 261.8%, or 323.6% of waves 1-2. These Fibonacci ratios offer comparative projections, not compulsory targets. If wave 3 extends, waves 1 and 5 may appear smaller by comparison, so judge the full sequence rather than assuming every advancing leg should match.
A diagonal can form a wedge-like structure, with price swings converging or widening rather than following a standard impulse outline. Leading diagonals can occur near the start of a move, while ending diagonals can signal that a trend segment is nearing completion. Distinguish a diagonal from a standard impulse by examining its shape and internal swings, and keep an alternate count if both readings remain possible.
When counts compete, keep the primary scenario and one alternate visible. For example, compare whether the proposed wave 3 satisfies the length rule and whether wave 4 avoids wave 1’s territory. That process makes the analysis testable: a new price swing can support one count, invalidate another, or require a fresh count without forcing the original interpretation.
Theory limitations and practical trading use
To label a chart, mark clear swing highs and lows, assign a wave degree, and test the count against impulse and correction rules. Compare the count across time frames before building a trading scenario.
Applying Wave Counts to Trading
A wave count organizes a trading scenario by outlining possible price paths, invalidation points, and decision zones. This matters because entries, stops, and exits should follow a defined structure, not just a predicted direction.
For example, a planned entry at 105 and a stop at 103.50 create price risk of 1.50 per unit. With a 150-unit risk budget, the example permits a 100-unit position before costs and execution allowances. The calculation links the chart scenario to position size instead of treating a wave target as a complete plan.
Then assess the reward relative to the planned loss. In the example, total costs of 10 reduce the modeled reward-to-loss ratio to 2.75. Costs change the setup’s net profile, so compare them with the projected exit before deciding whether the scenario fits your trading plan. A wave count frames the analysis; risk limits determine how much exposure the plan allows.
Time frame also changes the reading. A one-year chart can show a corrective wave while a 30-day chart shows a developing impulse. Use a 20-period moving average to observe price movement during impulsive and corrective waves, then compare it with the proposed count. This keeps the forecast connected to both larger structure and shorter-term action.
Practicing with Historical Charts and Paper Trading
To practise on historical charts, label past price swings before revealing what happened next, then review whether the count followed Elliott rules. Paper trading applies the same analysis to simulated decisions, helping beginners test entries, exits, and invalidation without placing a live trade.
Start with a chart and mark prominent turning points, then label a possible impulse or corrective wave. Check the count against the relevant rules and record an alternate interpretation when the structure supports one. A 1-minute candlestick chart is identified as the smallest scale for detecting wave patterns, but larger time frames can make the overall degree easier to assess.
For each paper trade, write down the entry, stop, projected exit, and the price action that would invalidate the count. Review the result after the scenario develops, including whether the error came from the count, the entry, or risk planning. An optional 15-minute analysis limit can organize practice sessions; it is a time-management method, not a formula for accuracy.
Keep a journal recording the chart’s time frame, wave degree, pattern, and your decision. Revisit the chart later and compare your original count with what unfolded. This review can expose repeated labeling errors and strengthen a consistent process. Elliott Wave analysis supports scenario planning, while position sizing and predefined exits keep each decision bounded by risk.
Elliott Wave Theory’s history and core principles
Ralph Nelson Elliott developed Elliott Wave Theory in the 1930s after studying 75 years of market charts. He looked for recurring structures in price movement, then organized those observations into a framework for interpreting market trends and corrections. That history matters because the method began with chart analysis, not a claim that one indicator could explain every market move.
The theory gained notoriety in 1935, after Elliott predicted a stock market bottom. That episode helped draw attention to his approach, but its lasting contribution is the structure it offers: describe a trend, identify corrective waves, and consider how smaller patterns fit broader movement. A historical prediction is a story about the theory’s development, not a reason to treat every present-day wave count as certain.
In 1978, Robert Prechter and A. J. Frost co-wrote Elliott Wave Principle: Key to Market Behavior. The book helped bring Elliott’s concepts to a wider trading audience. Its central idea is that market action can be analyzed through recurring motive and corrective patterns. Wave analysis therefore focuses on relationships between swings, rather than reading each price change in isolation.
Scale is central to this framework. Smaller waves can sit inside larger ones, so the same movement may look like a trend on one chart and a correction on another. A trending phase can be understood as a sequence of waves, though analysts may interpret its structure differently. This variation helps explain why counts differ: analysts may identify different degrees or interpret a turning point differently, especially before a pattern completes.
A reversal is not established simply because a chart reaches a projected level or forms a familiar shape. Treat a count as a structured interpretation: identify the trend, classify the intervening corrective waves, and test whether the proposed sequence remains coherent as new prices appear. This approach gives traders a way to compare scenarios without confusing a possible pattern with a confirmed change in direction.
Indicators can add another lens. The Elliott Wave Oscillator uses the difference between five- and 34-period moving averages to help assess price direction. It can support a wave reading, but it does not replace the count or the rules behind it. Compare the indicator’s movement with the chart structure, then note where the two readings agree or diverge.
The core takeaway is practical: Elliott’s 1930s framework organizes market movement into patterns that can be tested and revised. Use wave analysis to map a scenario, not to assume that a forecast determines the market’s next move. To put a structured trading approach into practice, open a trading account.
TradingPRO: Rookie Account
TradingPRO’s Rookie Account is an option to consider as you begin applying chart analysis. After studying Elliott Wave counts, Fibonacci levels, and risk planning, focus on using a consistent process for your trading decisions. The Rookie Account can suit readers looking for a starting point, while TradingPRO also offers Micro, Pro, and Scalp accounts for different trading approaches. Choose according to your goals and planned trading style, rather than treating an account as a substitute for analysis or risk management. Build your market knowledge first, then decide which account aligns with your approach. Visit TradingPRO to explore the Rookie Account.
Turn Your Market Perspective Into a Plan
The next step is to turn chart observations into deliberate decisions. Set your own criteria for when a scenario is actionable, how much risk you’ll accept, and what would make you step aside. A practical approach to Elliott Wave theory for beginners develops through consistent review, not by chasing every price move.
Choose an account that fits your trading goals and approach. TradingPRO offers Rookie, Micro, and Pro accounts. Let your preferred trading style and plans for managing decisions guide your choice.
Keep learning, refine your process, and make each decision with intent. Explore your next step with TradingPRO, and move forward with a clear plan.
Frequently Asked Questions
How Do Elliott Waves Work?
Analysts start with visible turning points, grouping connected price swings into a possible market sequence. They label the clearest completed movement first, then assess whether nearby swings fit within it or form a separate structure. For example, successive higher highs and pullbacks can support a bullish reading, while a failed follow-through may prompt a different count. Each label describes the chart, not what caused price movement.
What Does Market Psychology Add?
Market psychology offers one interpretation of why price swings can cluster into trends and pauses. A rising market may reflect growing optimism, while pullbacks can show profit-taking or fading conviction. Elliott Wave analysis turns these shifts into a chart framework, but it does not measure traders’ emotions directly. Consider sentiment alongside price behavior rather than treating a wave label as proof of what market participants feel.
What are the three rules of a standard impulse?
A standard impulse follows three rules: Wave 2 cannot move beyond the start of Wave 1; Wave 3 cannot be the shortest of Waves 1, 3, and 5; and Wave 4 cannot overlap Wave 1’s price territory. These constraints help test a proposed count. If price violates one, reject or revise that standard impulse count instead of shifting labels to make it fit.
What is Elliott Wave theory in simple terms?
In simple terms, Elliott Wave theory organizes price swings into patterns that traders can compare and test. It helps assess whether a chart’s movement appears to fit a developing trend or a pause within a larger move. Think of it as a map of possible structure: useful for planning what to watch, but not a mechanism that controls market direction.
What are the five-wave impulse and three-wave corrective patterns?
The five-wave impulse labels a trend-aligned sequence from Wave 1 through Wave 5. The three-wave corrective pattern labels a countertrend sequence A, B, and C. A chart reader uses these labels to distinguish a possible advance from a pullback, then checks how each sequence sits within the broader chart. The labels describe the pattern’s proposed structure, not a required future path.
What are the basic Elliott Wave rules and guidelines?
Rules determine whether a specific impulse count is valid; guidelines describe common proportions that may support an interpretation. For instance, a guideline might suggest a relationship between two waves, while breaking a rule disqualifies the proposed count. Keep these categories separate in your notes. A chart can diverge from a guideline and remain countable, but breaking a core rule requires a different impulse interpretation.
How do Fibonacci retracements and extensions work with Elliott Wave analysis?
Retracements measure a pullback within a price swing, while extensions compare the length of one wave with another to project possible continuation zones. First identify the relevant swing points before applying a ratio, since different anchor points produce different readings. If a projected zone overlaps a clear chart level, treat the overlap as an area to monitor, not an instruction to enter a trade.
How can Elliott Wave theory help identify price targets and trend reversals?
Wave analysis can outline conditional target zones based on proportions between swings and show where a proposed count would fail. For example, if an advance stalls near a projected area and price then breaks a key point in the count, reassess the trend scenario. A target is a planning reference; a reversal requires evidence in price structure, not simply contact with a projected level.


