




- Published on: 2026-11-04 10:08:11
5 Habits That Help Traders Make More Disciplined Decisions
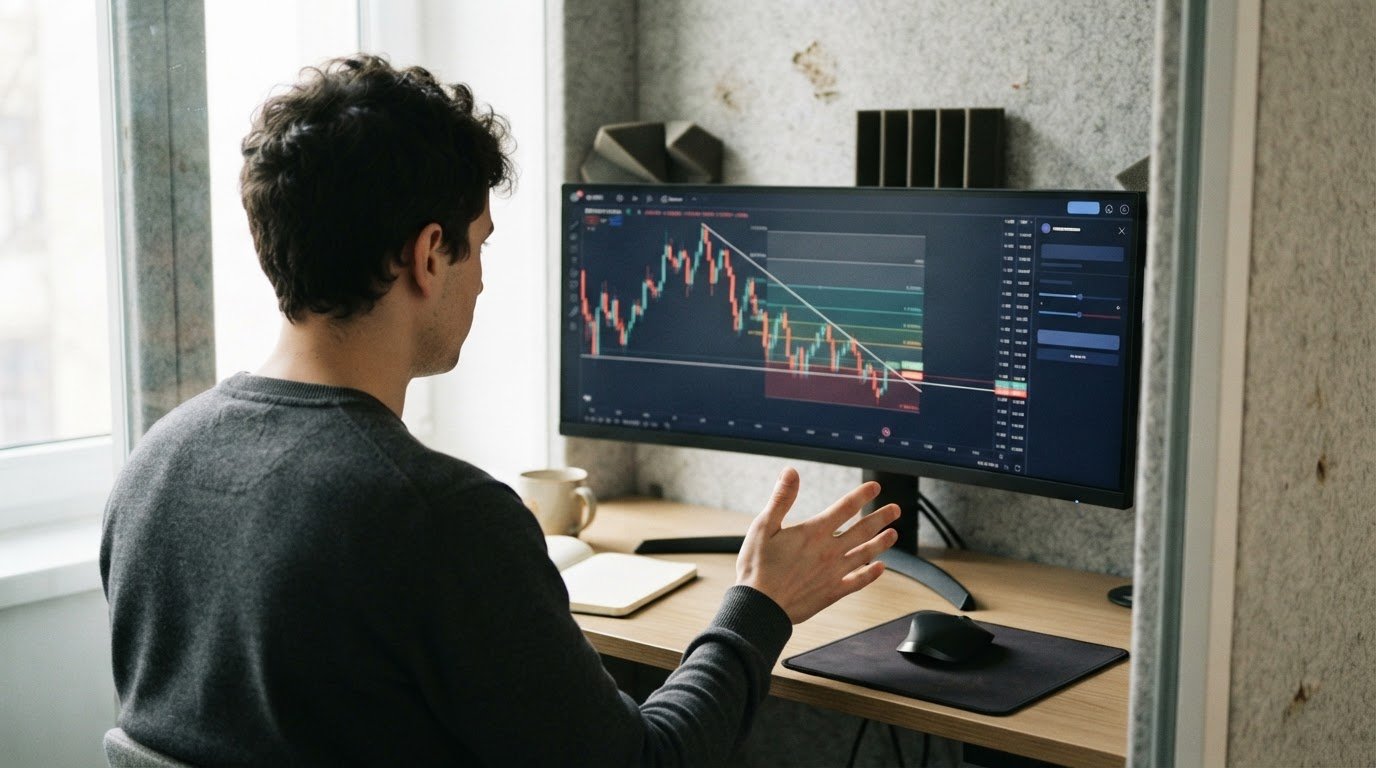
Only about 10% of people make it in the trading business. Learning how to be in the top 10% of traders starts with a repeatable process, not a promise of constant wins: wait for high-probability setups, define risk before entering, and follow your plan when emotions rise.
It’s natural to look for the perfect indicator or a strategy that works in every market. But disciplined trading depends on how you make decisions, manage losses, and match your approach to the market and timeframe.
Explore five habits that bring structure to your decisions, from using support, resistance, and other technical levels to avoiding hope-based trades. You’ll also learn how to adapt these principles across day trading, swing trading, forex, crypto, and stocks, so you can build a steadier approach without chasing every move.
Key Takeaways
- Use a small set of technical indicators alongside price action to assess trends and potential signals.
- Wait for setups that match your trading plan instead of entering the market out of impatience.
- Use support, resistance, and Fibonacci retracement levels to bring structure to trade decisions.
- Set your risk limits before entering, and follow your exit plan rather than relying on hope.
- Adapt your timeframe and strategy to the market you trade, whether it’s forex, crypto, stocks, or another market.
1. What are the Trading Strategies Best Traders Uses?
Technical indicators can help organize your analysis, but they can’t predict every price move. Pair signals with price action, key levels, and market direction before acting. For example, a moving average can help show whether prices are trending, while support and resistance can frame where a trade idea may fail.
A simple moving average (SMA) smooths closing prices across a chosen period. A 12-day SMA uses closing prices from 12 days, while a 200-day SMA uses 200 days of data. When price stays above a rising average, the trend points upward; when it remains below a falling average, the direction is downward. Treat these as context, not automatic buy or sell signals.
The Average Directional Index (ADX) measures trend strength on a scale from 0 to 100. Readings above 25 are commonly considered a strong trend, while readings below 25 suggest drift. ADX shows strength, not whether price will rise or fall, so check price action for direction. Combine it with key chart levels rather than treating the reading as a standalone entry trigger.
Oscillators can flag conditions that deserve closer attention. A Relative Strength Index (RSI) score over 70 is commonly considered overbought, while a score under 30 is considered oversold. A stochastic oscillator reading over 80 is commonly interpreted as overbought, and 20 or below as oversold. In a strong trend, however, an overbought reading doesn’t necessarily mean a correction is coming.
How can you avoid calling a top or bottom too early? Wait for price action to confirm a possible reversal at a level instead of acting because an indicator looks extreme. Technical signals are most useful alongside an assessment of price over time and the broader market trend.
What is a realistic annual return target for a skilled trader? There’s no single target that fits every strategy, market, and risk level. Set expectations based on your tested approach and risk-reward profile, not a fixed promise.
How much capital and what costs are needed to start trading in the US? The capital you need depends on the market, position size, and loss limit you can sustain; costs depend on the instrument and trading arrangements. Set a risk budget first, then determine whether your planned position fits it.
What percentage of retail traders are profitable over the long term? About 10% of people make it in the trading business, but that figure doesn’t establish the share of US retail traders profitable over the long term.
What performance metrics define a top 10% trader? The Federal Reserve measures trading performance using dollar profit and loss in standard deviation units, P/L normalized by value at risk (VaR), and P/L normalized by trading assets. Read those alongside drawdowns and consistency, not win rate alone; profitability doesn’t require winning more trades than you lose.
How should traders manage risk, position size, and drawdowns? Set a maximum loss in percentage terms and a specific amount you can accept losing, then size positions around the stop. A 2% cap on USD 10,000 means USD 200 at risk per trade; cut exposure when losses threaten your plan.
2. Trading less frequently and waiting for high-probability setups
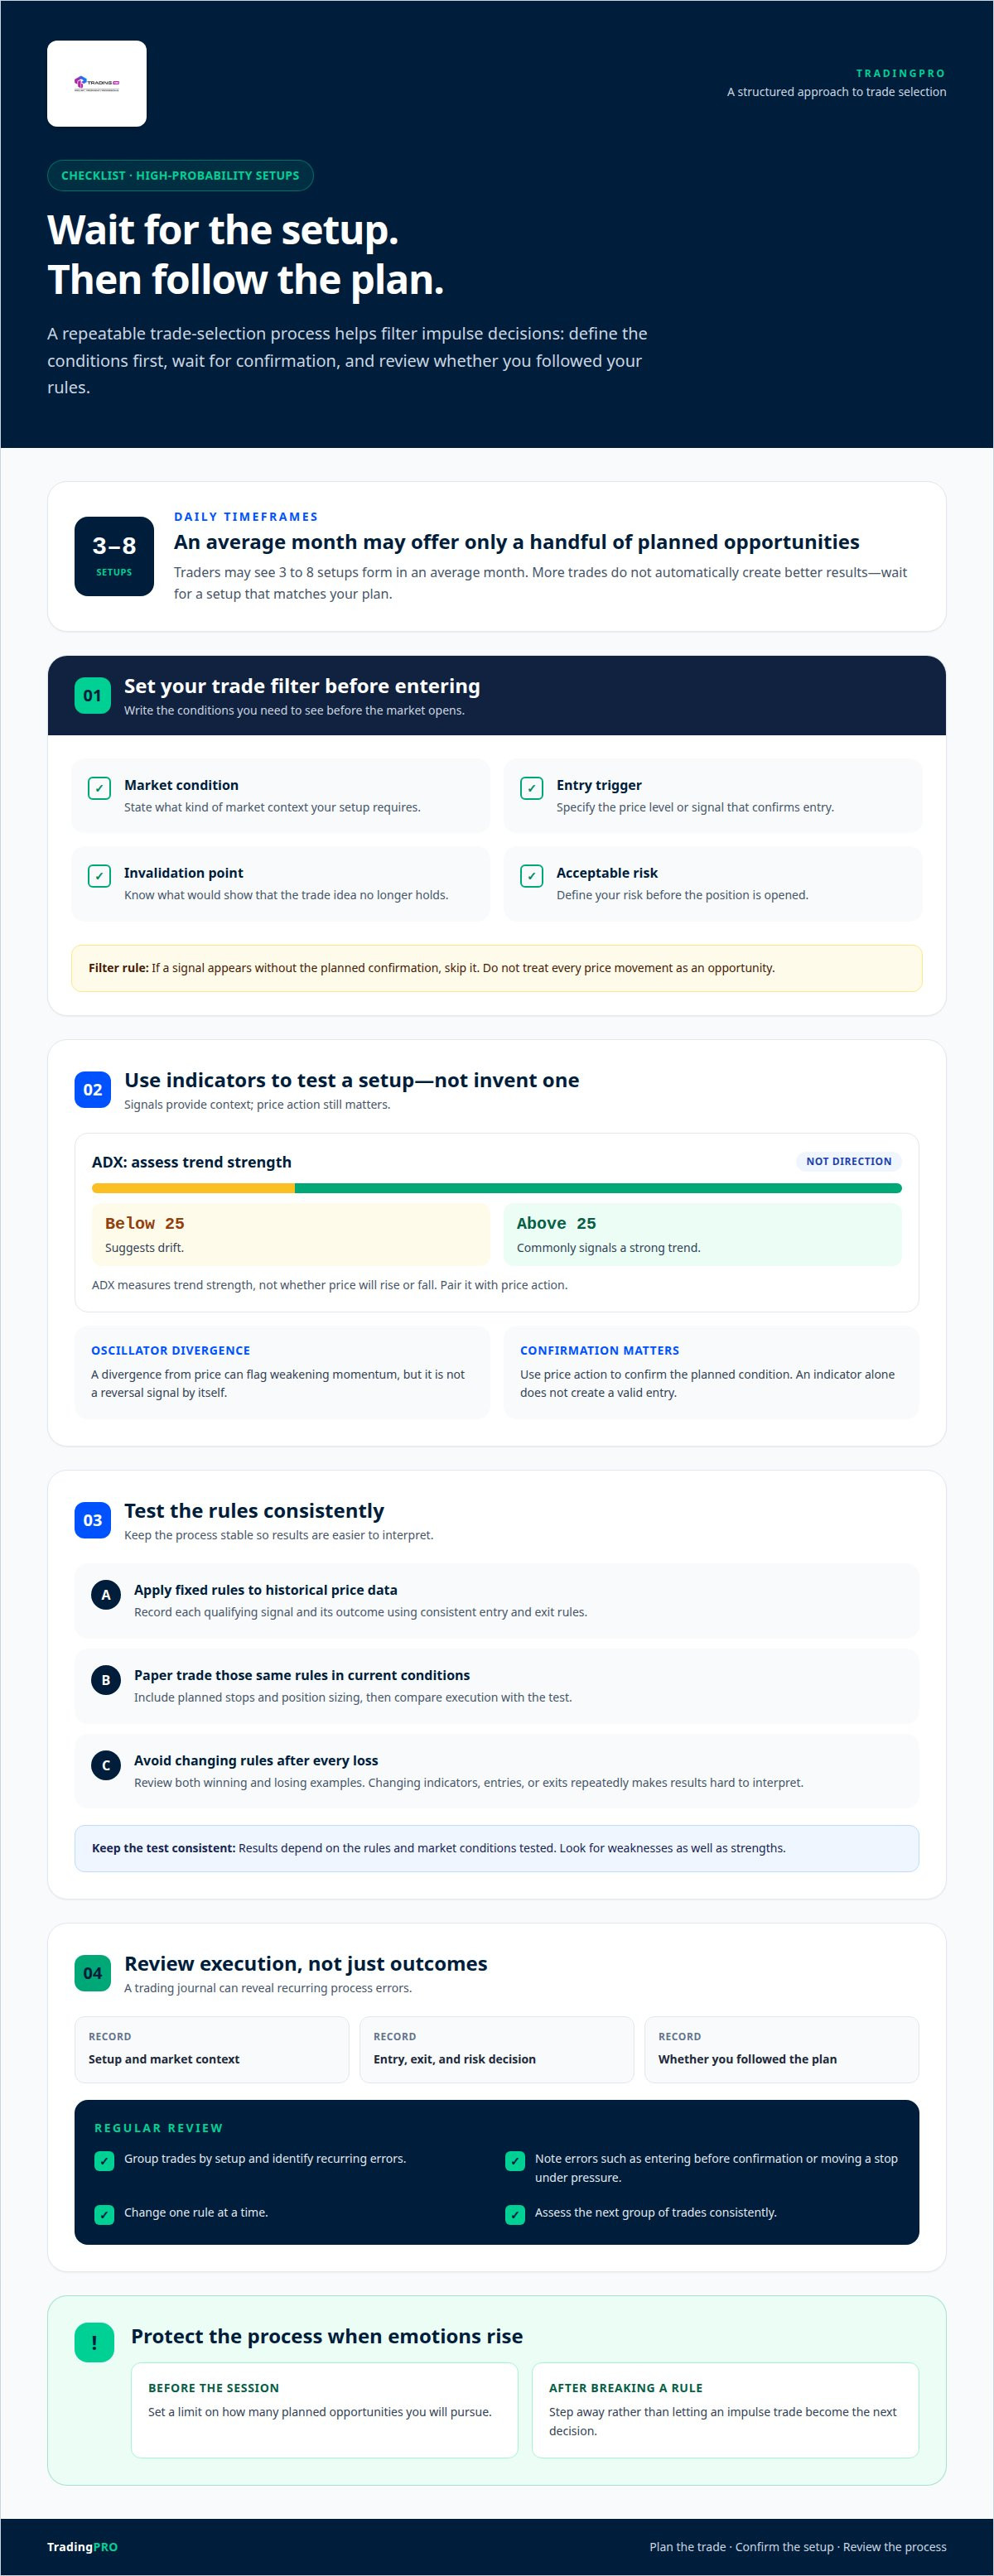
More trades don’t automatically create better results. On daily timeframes, traders may see 3 to 8 setups form in an average month. The discipline is to wait until a setup matches your plan, rather than treating every price movement as an opportunity. Before entering, define the market condition, trigger, invalidation point, and acceptable risk.
Use indicators to test a setup, not to manufacture one. For example, the Average Directional Index (ADX) can help assess trend strength: readings above 25 commonly signal a strong trend, while readings below 25 suggest drift. ADX doesn’t reveal direction, so pair it with price action. An oscillator’s divergence from price can flag weakening momentum, but it isn’t a reversal signal by itself.
Write your trading plan before the market opens. Specify the conditions you want to see, the price level that confirms entry, and what would invalidate the idea. Then wait. If a signal appears without the planned confirmation, skip it. This filter can reduce impulse trades and help keep decisions consistent as market conditions change.
How can traders backtest and paper trade a strategy before risking money? Apply fixed entry and exit rules to historical price data, recording each qualifying signal and its outcome. Then paper trade those same rules in current market conditions, including planned stops and position sizing, to see whether your execution matches the test.
Keep the test consistent. Changing an indicator, entry rule, or exit after every losing trade makes results hard to interpret. Review winning and losing examples, and note whether each trade followed the plan. Results depend on the rules and market conditions tested, so look for weaknesses as well as strengths.
How can traders track performance and improve through journaling and review? Record the setup, market context, entry, exit, risk decision, and whether you followed your plan. In regular reviews, group trades by setup and identify recurring errors, such as entering before confirmation or moving a stop under pressure. Change one rule at a time, then assess the next group of trades consistently.
Psychological control is part of the process. Set a limit on how many planned opportunities you’ll pursue in a session, and step away after breaking a rule. To build a structured routine for practice, you can create a trading account.
3. Fibonacci retracement and support and resistance
Fibonacci retracement gives traders a framework for mapping potential pullback areas between a clear swing low and swing high. Common levels are 23.6%, 38.2%, 50%, and 61.8%. These lines don’t predict a reversal. They mark places to watch how price behaves, then decide whether the developing signal fits your trading plan. A practical part of learning how to be in the top 10% of traders is treating these levels as context, not certainty.
Start with a visible price move, not a small fluctuation inside a noisy range. In an uptrend, plot from the swing low to the swing high; in a downtrend, plot from the high to the low. The resulting levels can help frame where a retracement may pause. Use the same swing points consistently, or comparisons between chart setups lose meaning.
Support and resistance add context to those Fibonacci lines. Support is an area where buying interest has previously interrupted a decline; resistance is an area where selling pressure has interrupted an advance. If a 38.2% retracement overlaps an earlier support zone, that confluence may deserve attention. It is still an observation, not proof that price will hold there.
Watch how price approaches each level. A sharp rejection, a close back above support, or a pause followed by renewed momentum can each signal something different from a clean break. If price breaks support and later fails to reclaim it, the former floor may act as resistance. Before entering, define what would invalidate your trade idea rather than shifting the decision point after the price moves.
Financial markets move through changing conditions, so a Fibonacci level that matters on one chart may have little relevance on another. Check the broader trend and nearby swing points before acting. For example, a retracement during a strong advance may be a temporary pullback; the same level in a range may simply fall among repeated reversals. Price action provides context that the line alone cannot.
Record how each setup behaves. In your trading journal, note the selected swing points, retracement level, nearby support or resistance, entry signal, and exit reason. Review examples from different market conditions. If a level repeatedly fails without confirmation, adjust the rule for requiring a price-action signal. This makes Fibonacci analysis a testable decision process rather than a chart decoration.
Use levels as areas, not exact promises. A trader can accept a setup only when price behavior, trend context, and the planned risk align. For anyone learning how to be in the top 10% of traders, that means avoiding automatic entries just because price touched 50% or 61.8%. Fibonacci retracement works best as one part of structured analysis, alongside support, resistance, and a clearly defined exit.
4. Managing emotions and avoiding hope-based decisions
Hope can turn a planned trade into an emotional decision. A trader enters with a clear exit, sees price move against the position, then delays closing because a reversal still feels possible. Replace that feeling with a rule: define the point that invalidates the trade before entry, and follow it if price reaches that level.
Common mistakes that can hurt retail traders include holding losing positions in the hope of a reversal, abandoning an exit plan, and entering impulsively after a loss. These actions replace analysis with emotion. If a setup no longer meets its original conditions, reassess it using the same criteria you used before entering.
Use a written decision framework to separate evidence from impulse. Before each trade, record the reason for entry, the price action that would support the idea, and the condition that would disprove it. After entry, compare new information with that framework. Don’t treat every price fluctuation as a reason to rewrite the plan.
A pause can interrupt reactive trading. After an unexpected loss, step away from the chart and review whether you followed your rules. If you did, record the result without treating one outcome as proof that the strategy failed. If you didn’t, identify the specific decision that departed from the plan, such as moving an exit or chasing price.
Keep risk decisions separate from your hopes for a trade. Set a maximum acceptable loss and position size before entering, then avoid increasing exposure just to recover a previous loss. A trader can be profitable without winning more often than losing, provided winning trades earn more than losing trades cost. Following your risk plan matters more than trying to avoid every loss.
Include an emotional review in your trading journal. Alongside each entry and exit, note whether you felt impatient, fearful, or overconfident, and what action followed. Compare those notes with the trade’s outcome and your plan. Repeatedly entering early after missing a move, for instance, points to a specific habit to address.
Investing and active trading require different decision frameworks. A long-term investor may assess a position over an extended horizon, while a short-term trader follows a defined exit for a specific setup. Don’t use an investing rationale to justify holding a trade after its trading conditions have failed. Use a clear framework for each position and review decisions against it.
Discipline doesn’t mean suppressing every emotional response. It means noticing the response, pausing, and acting only when the planned conditions remain valid. When uncertainty rises, return to your written entry, risk, and exit rules instead of relying on hope.
Day, swing, forex, crypto, and stock traders
Your trading style should match the market, holding period, and decisions you can execute consistently. A day trader may focus on intraday price movement, while a swing trader plans around moves that unfold over a longer period. Neither timeframe is automatically superior. Choose one, define its entry and exit rules, and assess performance within that same framework.
For stock trading, build each idea around the individual company’s price action and the broader market context. A long-term investor’s reasoning may not fit an intraday trade: if the short-term setup fails, belief in the company’s future doesn’t automatically justify holding. Record the time horizon before entry so your exit decision reflects the strategy you chose.
Forex traders assess currency pairs, where one currency’s value is quoted against another. A move in EUR/USD, for example, reflects the pair’s changing exchange rate, so your plan must specify the direction and invalidation point. Forex trading may involve leverage, which can magnify both gains and losses. Set exposure according to the loss you can tolerate, not the size of a possible win.
Crypto traders face different market conditions from stock traders. A digital asset can move sharply, so a recent price surge alone isn’t evidence of a reliable setup. Define what would confirm your entry and what would invalidate it. Don’t let fear of missing the next move turn an unplanned entry into a trade.
How do stock, options, futures, and forex trading compare in risk and costs? Risk depends on the instrument, position size, leverage, market movement, and exit plan; costs depend on trading frequency and the instrument’s pricing structure. Options add contract-specific factors, while futures and forex can involve leverage. Compare the full exposure and possible loss before choosing.
Keep your method consistent across markets. A day trader might define an exit within the session, while a swing trader may use a broader chart structure. In either case, set a risk-reward ratio, position size, and exit condition before entry. Review losing trades as closely as winning ones; the goal is to learn whether your decisions followed the plan.
Don’t switch strategies after one disappointing result. Compare like with like: review stock trades separately from forex or crypto trades, and separate day trades from swing trades. This helps you see whether results came from the setup, market conditions, or execution. Discipline means following a tested process, not forcing the same trade into every market.
Ready to put a structured trading routine into practice? Create your trading account and apply your rules with a clear plan for each market.
TradingPRO
TradingPRO offers Rookie, Micro, Pro, and Scalp Accounts for traders seeking an account tier that suits their trading approach. As you put these habits into practice, choose an option that fits the way you plan and manage trades. If you’re interested in following other traders’ strategies, TradingPRO also offers Social Trading and Copy Trading.
Keep your focus on the process: define your setup, manage risk, and review decisions consistently. Your account option is one part of that routine, not a substitute for a trading plan or disciplined execution.
Contact TradingPRO to discuss which account option may suit your trading approach.
Make your next trading decision count
Progress comes from turning good intentions into a repeatable process. Choose one improvement to focus on next, such as waiting for clearer confirmation or reviewing whether your decisions matched your plan. Track how you apply it, then use those observations to refine your approach as market conditions change.
Learning how to be in the top 10% of traders isn’t about forcing more activity or chasing a perfect outcome. It’s about building decision-making habits that hold up when trades go against you, markets shift, or new opportunities appear. Keep your rules clear, stay selective, and make your next move deliberately.
TradingPRO offers account options including Rookie, Micro, and Pro. To take a practical next step and explore your trading path, connect with TradingPRO and get started.
Keep learning, refine your approach, and let consistency guide your progress.
Frequently Asked Questions
How to Become a Great Trader?
Become a stronger trader by turning your method into a repeatable decision process. Choose a market and timeframe, define exactly what qualifies as an entry, and record how you manage each trade. Then review your execution, not just the outcome. A profitable trade that broke your rules still reveals a process problem. Improve one decision at a time and keep your criteria consistent during review.
What are the Trading Strategies Best Traders Uses?
Effective strategies connect a market condition to a clear entry, exit, and risk decision. A trend-following setup, for example, might require price to break a prior range and hold beyond it before entry. Specify what confirms the setup and what cancels it. Indicators can support your analysis, but test them alongside price behavior rather than treating a reading as a complete strategy.
Who are The Most Successful Day Traders?
There’s no single definitive ranking, but several traders are known for notable market records. These examples represent different periods and approaches, not a guarantee that their methods can be replicated. Focus on the decision process behind a strategy, rather than a trader’s headline result.
Which trading strategies have evidence of long-term profitability?
No strategy is profitable in every market condition. To assess whether one has durable potential, test its rules against historical data and across different market environments, then evaluate performance beyond the period used to develop it. Include losses, drawdowns, and trading costs in your review. Depending on their goals and circumstances, a diversified, low-cost, long-term buy-and-hold approach may suit many people better than active trading.


